July 13, 2026

Capitalizations Index – B ∞/21M

Major Crypto Assets See Solid Growth, Total Market Cap Holds Above $300 Billion

Major crypto assets see solid growth, total market cap holds above $300 billion

Major Crypto Assets See Solid Growth, Total Market Cap Holds Above $300 Billion

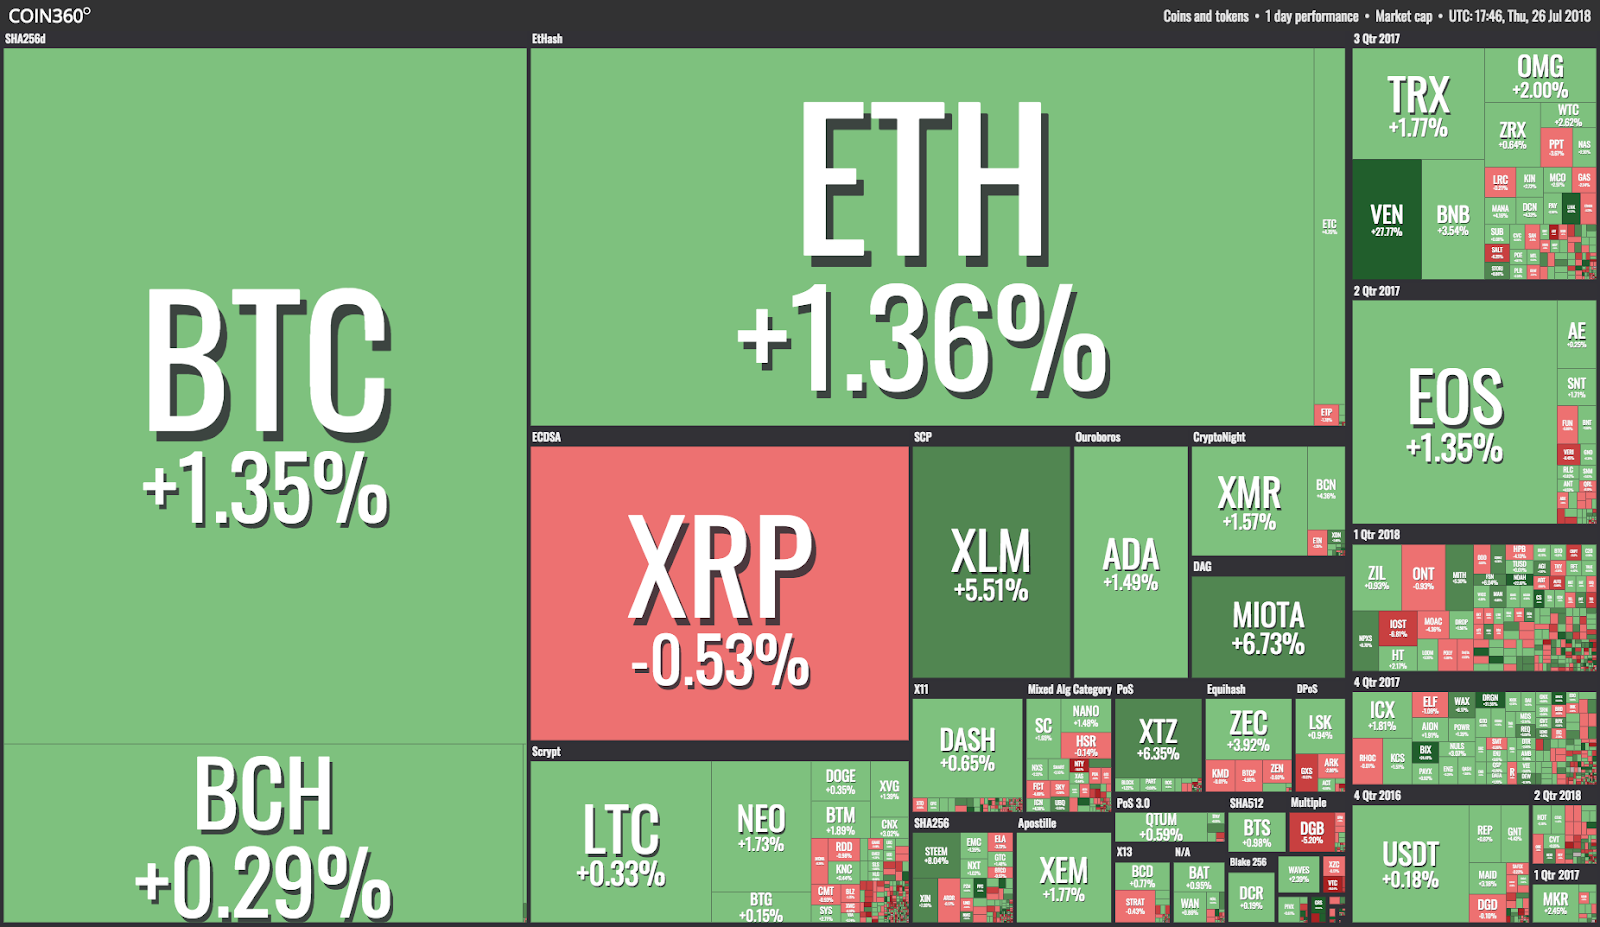
July 26: crypto markets are seeing a healthy flush of green, with most of major crypto assets seeing solid growth over the 24-hour period, as data from Coin360 shows.

After leading last week’s major market rally when Bitcoin (BTC) broke the $8,000 psychological price point, the leading cryptocurrency has been consolidating its gains. Altcoins are also holding market confidence, with most of the top ten coins by market cap seeing growth of between 1 and 7 percent on the day to press time, according to CoinMarketCap.

Market visualization

Market visualization from Coin360

Bitcoin (BTC) is trading around $8,230 to press time, up just over 1 percent on the day. The largest cryptocurrency peaked at just below $8,300 earlier today — nonetheless shy of its weekly high of $8,431 yesterday, July 25.
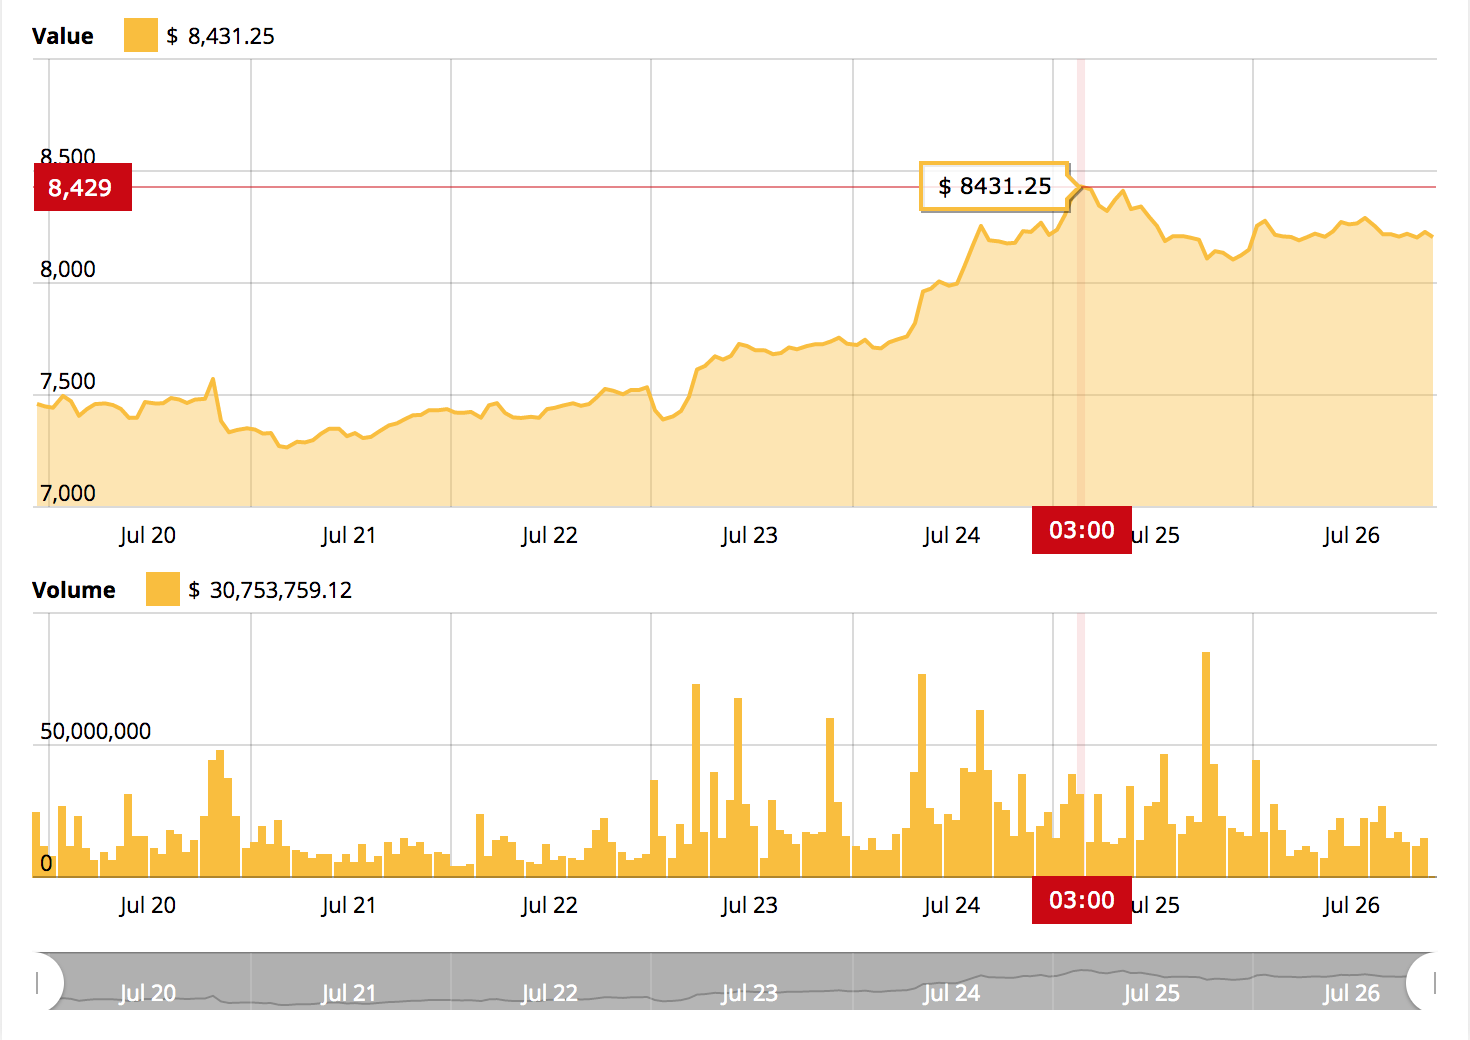
Weekly high in bitcoin’s 7-day price chart

Weekly high in bitcoin’s 7-day price chart. Source: Cointelegraph Bitcoin Price Index

bitcoin’s weekly and monthly gains are at a bullish 11.9 and 33.3 percent respectively, according to data from Cointelegraph’s price index.

Earlier today, Blockchain Capital partner Spencer Bogart bullishly compared bitcoin’s price to a “tinderbox,” saying the asset is “waiting for reasons to go higher.”

BTC dominance by market capitalization is at 46.9 percent according to CoinMarketCap, just under yesterday’s level, but still slightly above the 2018 record-high posted earlier this week.  

Ethereum (ETH) is trading around $478 at press time, seeing around a 1 percent gain on the day. The altcoin saw a bullish surge to $483 earlier today and has subsequently slightly retracted to its current level. Ethereum has now brought its weekly and monthly price performance into solid positive territory, with gains of around 3 and 9 percent respectively.
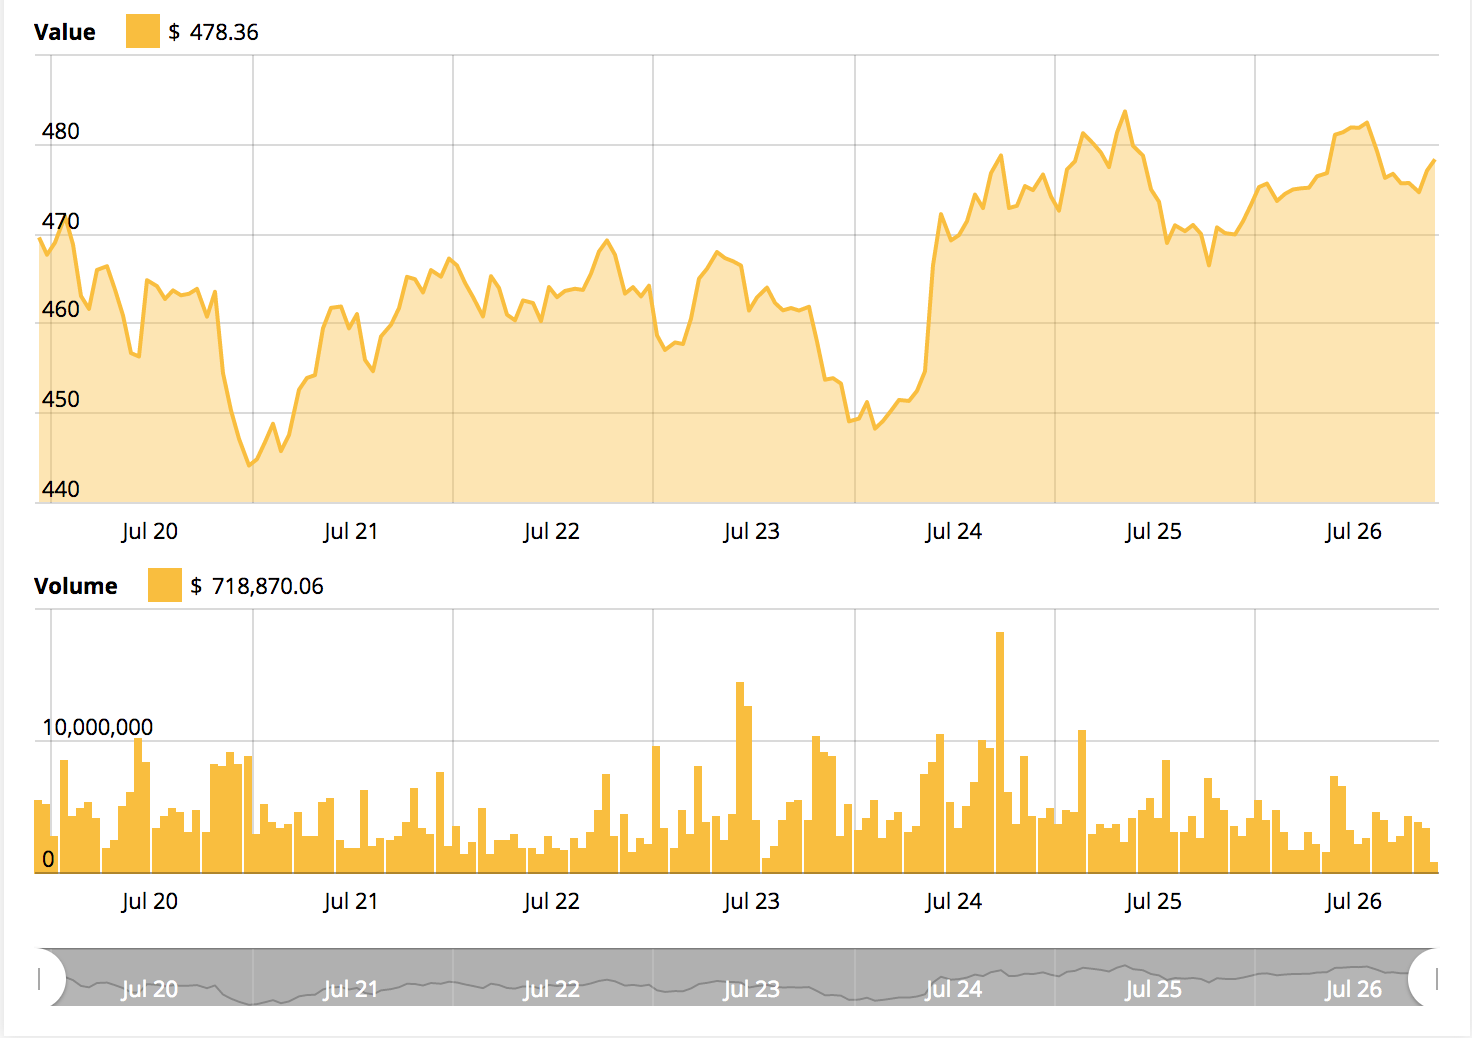
Ethereum’s 7-day price chart

Ethereum’s 7-day price chart. Source: Cointelegraph Ethereum Price Index

On CoinMarketCap’s listings, almost all of the top 10 coins by market cap are all in the green, with only Ripple (XRP) seeing a small loss on the day of about half a percent, trading at $0.46 to press time, according to CoinMarketCap. Litecoin (LTC) is also seeing minor losses on the day, down just 0.18 percent to trade at $86.75 by press time. The last top ten coin in the red is Cardano (ADA), also down just a fraction of a percent, trading at $0.17 per coin.

Of the top ten coins, IOTA (MIOTA), the ninth largest cryptocurrency by market cap, has performed the strongest today, seeing over 7 percent growth to trade at $1.05 to press time.

Of the top 20 coins on CoinMarketCap, VeChain — ranked 17th by market cap — has skyrocketed almost 28 percent on the day, trading at around $2.51 to press time, and hitting as high as $2.66 earlier today.
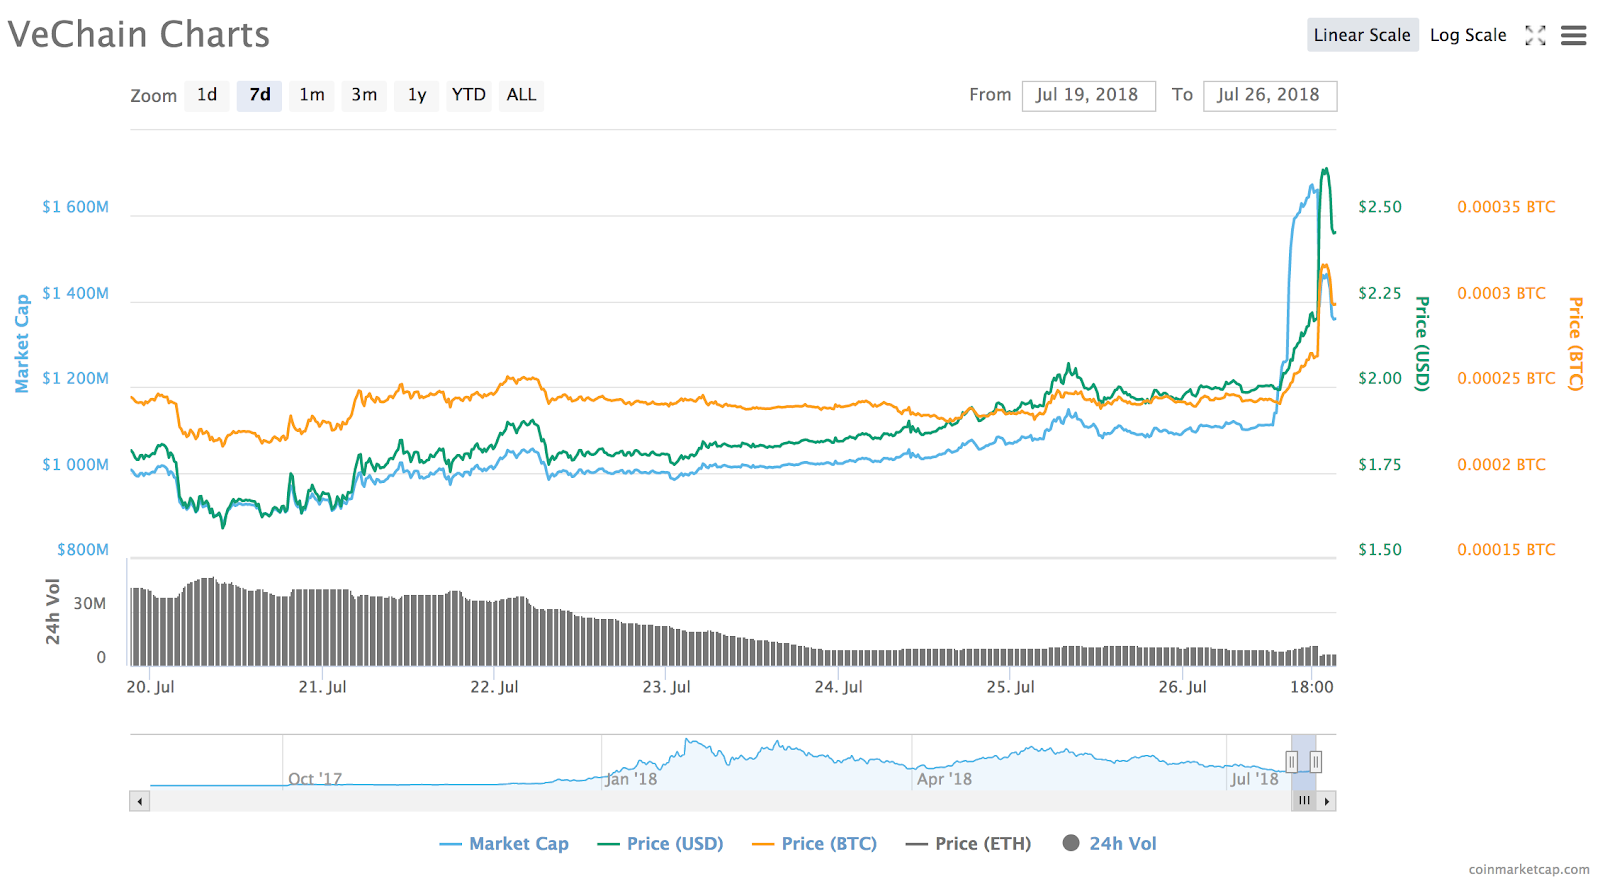
Vechain 7-day chart

VeChain 7-day chart. Source: CoinMarketCap 

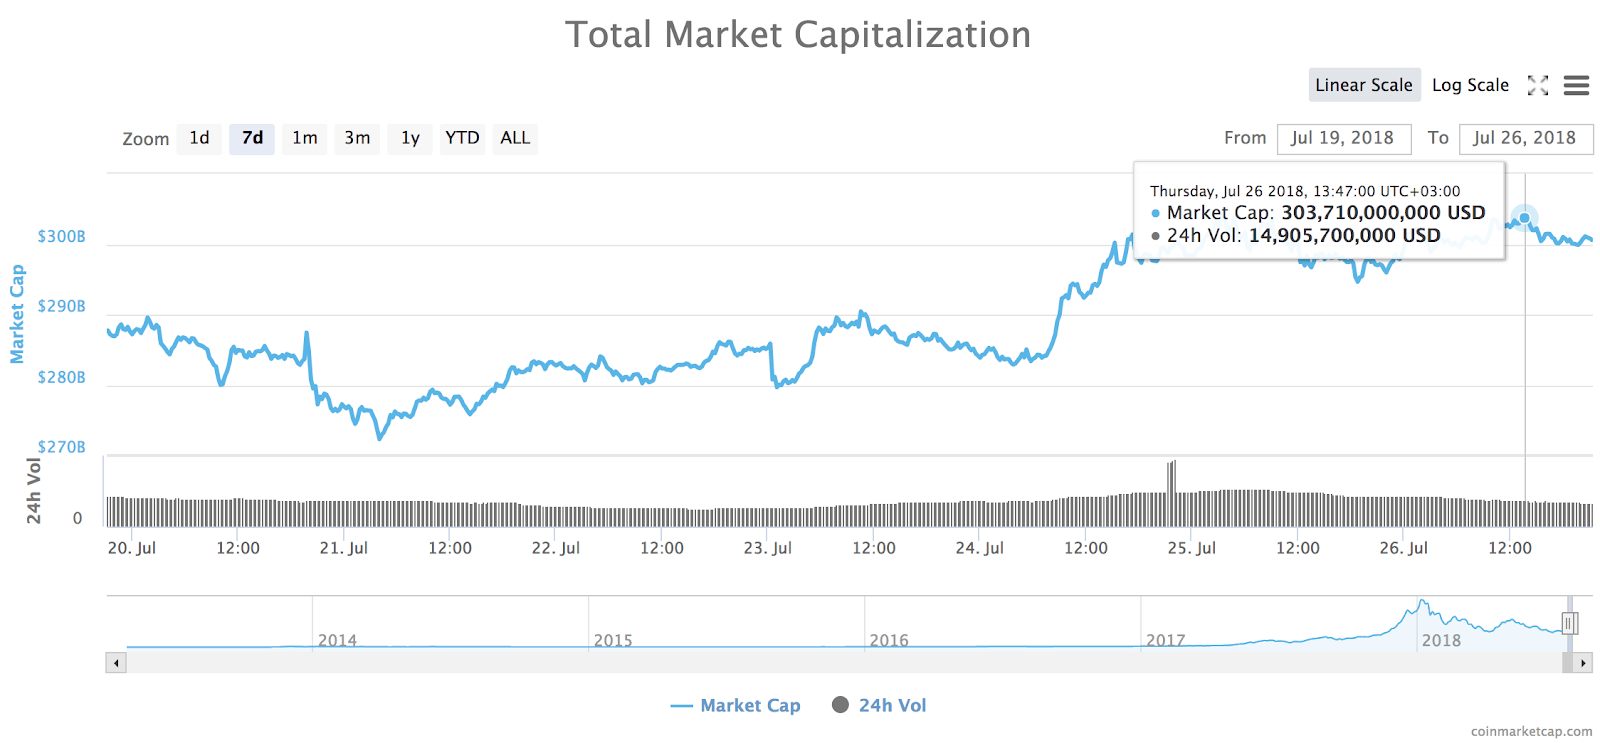
Total market capitalization of all cryptocurrencies is around $302 billion at press time, after surging to as high as $303.7 billion earlier today.
24-hour high in the total market capitalization of all cryptocurrencies

24-hour high in the total market capitalization of all cryptocurrencies from CoinMarketCap

At a U.S. house committee hearing yesterday, the chairman of the U.S. Commodity Futures Trading Commission (CFTC) said that the government is lagging “four years behind” and urgently needs to test blockchain technology to "see how it can help us do a better job as regulator.”

Crypto investors have been closely eyeing both the CFTC’s and the U.S. Securities and Exchange Commission (SEC)’s evolving regulatory stance towards the industry. Recently, attention has focused on the latter’s potential approval of crypto-based exchange-traded funds (ETFs), which some consider could be a “holy grail” for the market.

Recent news that the $6.3 trillion asset management heavyweight BlackRock –– the world’s largest provider of ETFs –– is beginning to assess potential involvement in bitcoin has been credited by some with triggering this month’s ongoing impressive rally, that kicked off July 16.

This week, the SEC delayed its decision on a bitcoin ETF application from investment firm Direxion, the same day as digital asset manager Bitwise filed its own application with the regulator for an ETF that would track an index of ten cryptocurrencies.

Published at Thu, 26 Jul 2018 20:10:00 +0000

Altcoin

Previous Article

KODI XENON BUILD FASTEST INSTALL OF 2018 DOWNLOAD THE NEW KODI XENON APK IN JUST A FEW MINUTES

Next Article

Toledo Coin Exchange Jan REVISED

You might be interested in …

Fintech Start Up – Data Engineer

Fintech Start Up – Data Engineer Fluz is aiming to disrupt the global retail shopping experience through various consumer touch points.We are a FinTech company sitting in the intersection… FluzNew York, NY 10036 From Indeed […]

Bitcoin Price Analysis: After Giddy Heights, Bitcoin Sees a Steady Decline in Price

Bitcoin Price Analysis

In the days leading up to the various bitcoin futures markets opening, bitcoin saw a push to fresh all-time highs near $20,000. However, shortly after reaching these values, the market saw a steady decline in price as demand dwindled and supply began to dominate the market. In the last bitcoin market analysis, we discussed a possible distribution phase for bitcoin and a potential hypodermic breakdown of the strong, parabolic trend the market has seen. Let’s take a look the latest developments:

Figure_1 (1).JPGFigure 1: BTC-USD, 1-Hour Candles, Distribution Update

One troubling aspect of this current price trend is the high volume leading into all the dips, and the low volume on the price rises. This price action shows both the diminishing demand in the market and the overwhelming supply that is beginning to take dominance in the market. Currently, bitcoin is perched on a potential part of the trading range called “Last Point of Supply” (LPSY): this offers a final opportunity for the large players who have not exited the market to finally exit before an ultimate correction.

As discussed in the previous article, there is a strong, aggressive trend called the hypodermic trendline:

Figure_2 (1).JPGFigure 2: BTC-USD, 4-Hour Candles, Hypodermic Trendline

The hypodermic trendline represents a break outside of the parabolic envelope that dominated the market trend for over three years. The hypodermic trend also represents an aggressive price trend that is fairly difficult to maintain because of the demand required to keep the price aloft.

Currently, the price is sitting below this trendline and has rejected its initial test of the trend. At the moment, BTC-USD is testing the support of the trading range (shown in blue) and is systematically going through support tests as the market finds new lows.

A breakdown of this hypodermic trend, and a possible breakdown of this trading range, could easily send the market down to test the parabolic curve (shown in black):

Figure_3.JPGFigure 3: BTC-USD, 1-Day Candles, Macro Trend

There is likely to be very strong support along the parabolic trend that will stifle any potential price drops. As always, it’s important to watch the volume with the price growth or drops to confirm the likely direction of a move. As we test new lows, any volume growth will likely signal a continuation of the downtrend and ultimately have us testing the lower boundaries of the trading range.

Summary:

  1. bitcoin is potentially at its Last Point of Supply as it begins to test new lows in its current downtrend.

  2. bitcoin broke below the hypodermic trendline, which usually signals a breakdown in trend.

  3. Support will be found along the lower boundary of the trading range and will likely slow down any potential price drops.

Trading and investing in digital assets like bitcoin and ether is highly speculative and comes with many risks. This analysis is for informational purposes and should not be considered investment advice. Statements and financial information on bitcoin Magazine and BTC Media related sites do not necessarily reflect the opinion of BTC Media and should not be construed as an endorsement or recommendation to buy, sell or hold. Past performance is not necessarily indicative of future results.


The post Bitcoin Price Analysis: After Giddy Heights, Bitcoin Sees a Steady Decline in Price appeared first on Bitcoin Magazine.