July 6, 2026

Capitalizations Index – B ∞/21M

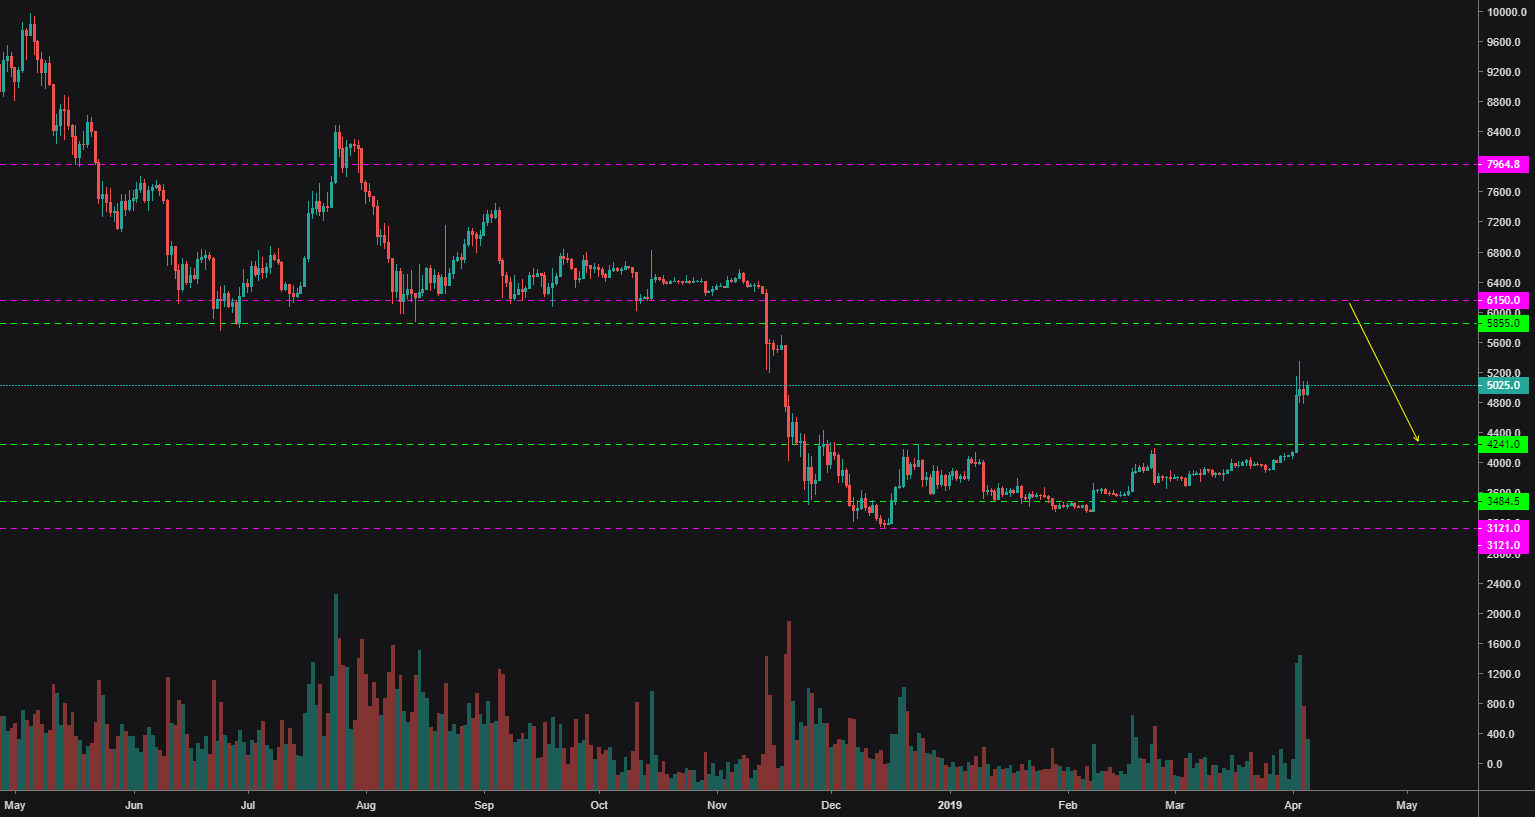
Incoming BTC short

Incoming btc short

Incoming BTC short

Incoming btc short

There’s no doubt that with the volume behind it, bitcoin wants to make a push to the liquidity it will find between 5800 and 6300.

If this push happens quickly, the profit taking of those who got long anywhere below 5500 as well as selling from everyone who bought at 6k and is waiting to get out at break even will cause a massive reaction back toward support at 4200, which is yet to be tested.

A short taken at 6150 with a stop above 6400 could be the most profitable and fast trade of this year.

HAGW!

Published at Fri, 05 Apr 2019 23:40:06 +0000

Previous Article

Wien Energie and Bosch Develop Blockchain Tech Refrigerator

Next Article

Wall Street is Helping Drive Bitcoin

You might be interested in …

Bitcoin Price Analysis: Bitcoin Rests at Tipping Point Before Deciding Next Move

Bitcoin Price Analysis

bitcoin prices have currently stalled out in the $16,000s as the market decides if it wants to continue the ravenous bull trend or go through a more corrective phase. In the last 30 days, the price of bitcoin has doubled — entering into what most traditional market analysts would deem “bubble territory.” bitcoin’s growth has been so rapid, it has managed to break north out of a parabolic trend to form an even more aggressive parabolic shape known as a “hypodermic trend.” Let’s take a look at the macro view of bitcoin and see if this trend is sustainable or ripe for a correction:

Figure_1.JPGFigure 1: BTC-USD, 1-Day Candles, Macro Trend

The image above shows a multi-year, parabolic envelope that, until recently, has guided the bitcoin bull market. Within the parabolic envelope we see a strong linear channel (shown in purple) that has provided very strong support and resistance through much of the bitcoin price growth. At the end of November 2017, however, bitcoin price growth was so strong, it managed to break out of both the linear and parabolic trends and form a more aggressive price trend: a hypodermic trend.

Figure_2.JPGFigure 2: BTC-USD, 60-Minute Candles, Hypodermic Trendline

The solid red line represents an aggressive support line that has guided this new, aggressive price growth out of the parabolic envelope. As of the time of this article, I am monitoring a trading range very closely as it nears this hypodermic trend. A breakdown below this hypodermic trend represents a diminished trend of demand in the bitcoin market, and it could ultimately lead to a local top on for BTC-USD. Paired with this hypodermic breakdown is a breakdown of the trading range (shown in blue) that has a span of approximately $5,000. A breakdown of a trading range that large would have quite a meaningful market reaction and is likely to see a profound correction before bitcoin buyers step back in.

However, before we get all doomsday-esque, it’s important to remember that distribution phases and reaccumulation phases are quite similar in shape and are called “evil twins” of one another. It’s entirely possible we could see new all-time highs out of bitcoin but, given the weak and anemic follow-through of each all-time high breaching the trading range, I am inclined to lean less toward accumulation and more toward distribution.

As always, volume will be a huge indicator in this process; a great telltale that we are, in fact, in an accumulation phase will be volume growth coupled with price growth. If we begin to push new highs and we see a volume growth trend combined with it, there will be a great sigh of relief from traders as this pairing will indicate increasing demand and diminishing free-floating supply in the market.

Summary:

  1. The price of bitcoin has doubled in the last month.

  2. The price growth has been so aggressive that it has broken north of a parabolic trend it’s been well-confined within for 3 years.

  3. bitcoin is at a crucial point as it currently decides whether it wants to move up or down in price.

Trading and investing in digital assets like bitcoin and ether is highly speculative and comes with many risks. This analysis is for informational purposes and should not be considered investment advice. Statements and financial information on bitcoin Magazine and BTC Media related sites do not necessarily reflect the opinion of BTC Media and should not be construed as an endorsement or recommendation to buy, sell or hold. Past performance is not necessarily indicative of future results.

The post Bitcoin Price Analysis: Bitcoin Rests at Tipping Point Before Deciding Next Move appeared first on Bitcoin Magazine.