July 18, 2026

Capitalizations Index – B ∞/21M

Bitcoin: Safe Haven Asset or Lead Indicator for the S&P?

Bitcoin: safe haven asset or lead indicator for the s&p?

Bitcoin: Safe Haven Asset or Lead Indicator for the S&P?

It’s been a tough first quarter for both bitcoin and equities across the globe.

Interestingly, the historically uncorrelated financial assets have moved pretty much in tandem since early February, forcing experts to search for reasons behind the growing relationship.

To start with, bitcoin bulls have been arguing since the early years that the cryptocurrency shares many of the characteristics of gold (a classic safe haven asset). For instance, many consider it a great store of value, given its limited supply of 21 million. Accordingly, the cryptocurrency is expected to put on a good show during times of stress in the broader financial markets.

Yet, since the S&P 500 index, the benchmark for equities across the globe, fell from a record high of $2,872 to $2,532 in the two weeks to Feb. 9, it should have been the perfect time for bitcoin to score gains and strengthen its safe-haven appeal.

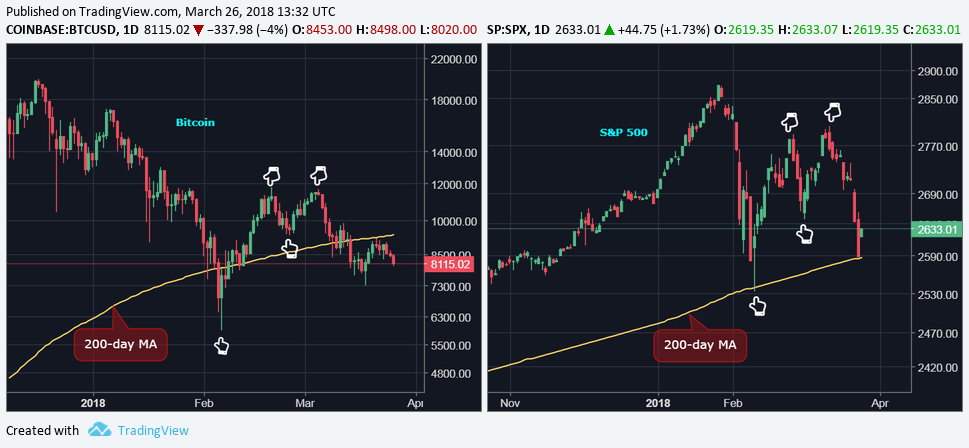
However, the comparative study of bitcoin and S&P 500 reveals that wasn’t the case.

Comparison chart: bitcoin and S&P 500
Bitcoin: safe haven asset or lead indicator for the s&p?

The above chart (BTC price as per Coinbase) shows:

  • Both bitcoin and the S&P fell below the 200-day moving average (MA) in the first half of February.
  • In the subsequent weeks, both assets witnessed a corrective rally and ended up forming a double top bearish reversal-like pattern.

Furthermore, bitcoin has been leading the S&P 500 index by a few days.

For instance:

  • BTC bottomed out at $6,000 on Feb.6, while the S&P index did so at $2,532 on Feb. 9.
  • The near 90-degree corrective rally in BTC ran out of steam at $11,775 on Feb. 20, while the “V-shaped” recovery in the S&P faced exhaustion on Feb. 27.
  • BTC resumed its sell-off on March 5, while the S&P found fresh offers on March 13.
  • Both assets fell back to their respective 200-day moving average levels last week.

Clearly, the correlation has strengthened and it appears as though bitcoin is working as a lead indicator, or a risk barometer, for the broader financial markets, and an argument can be made that bitcoin is not holding up its reputation as a “digital gold” or a safe-haven asset.

That said, it’s worth noting that correlation does not mean causation – that is, BTC is not necessarily causing the drop in the S&P, or vice versa.

The S&P 500 index, or the equity markets, in general, will likely be reporting losses for the first quarter, largely due to fears of faster Fed rate hikes and the rising bond yieldspolitical turmoil in Washington and increased odds of US-China trade war.

Meanwhile, bitcoin has taken a hit, in part due to deeper crackdown on cryptocurrency trading in South Korea and China. Furthemore, the cryptocurrency was due for correction following a staggering rally to an all-time high of $20,000 in December.

So, while there is no common thread between the drop in equities and bitcoin, the correlation between the two has strengthened – and that’s most likely because the investor community is still not ready to accept notoriously volatile bitcoin as a safe haven asset such as gold and U.S. treasuries. Not yet, anyway.

Stock prices image via Shutterstock

The leader in blockchain news, CoinDesk is a media outlet that strives for the highest journalistic standards and abides by a strict set of editorial policies. CoinDesk is an independent operating subsidiary of Digital Currency Group, which invests in cryptocurrencies and blockchain startups.

Published at Tue, 27 Mar 2018 14:00:19 +0000

Markets[wpr5_ebay kw=”bitcoin” num=”1″ ebcat=”” cid=”5338043562″ lang=”en-US” country=”0″ sort=”bestmatch”]

Previous Article

Bitcoin Ben Update: WE ARE CRYPTO! This is a Movement.

Next Article

Vitalik Wants You to Pay to Slow Ethereum's Runaway Growth

You might be interested in …

Bitcoin Price Analysis: Post-Fork Markets Await Enabling of BCH Deposits

Bitcoin Price Analysis

As expected, the events leading up to the BTC hardfork were dramatic. Before splitting off with its hardfork counterpart (bitcoin Cash), BTC-USD saw drastic swings in price with wildly different market values, depending on the exchange. While some exchanges saw new all-time highs being achieved (Kraken BTC-USD), others began to see discounts in their BTC-USD values. At points, there were even $100+ premiums between Kraken and Bitfinex.

At time of this article, bitcoin Cash (BCH) markets on most major exchanges have existed in a bubble as BCH deposits and withdrawals have been halted. There are many theories regarding the isolation of exchanges and their corresponding BCH-USD markets’ effects on the BTC-USD markets. Given this bit of information, one can assume that the dramatic rise in BCH market cap is unreliable at the moment. There is a large portion of the bitcoin community that is unable to sell its forked BCH and is currently sidelined. As such, this analysis will only take a look at BTC-USD price trend and what we can expect there.


Want to learn how to claim your BCH? Find out here.


Looking at the macro trend of the BTC-USD market, we can see that a previous test of the 23% Fibonacci Retracement values was strongly tested and subsequently rejected in the days leading up to the hardfork:

Figure_1_Macro_Fibs.JPGFigure 1: BTC-USD, 12HR Candles, Bitfinex, Macro Fibonacci Retracement Lines

The $2500 values have proven to be a formidable foe for those looking to the short the market, and last week was no exception. To date, $2500 values have built a strong level of support over the past couple months and will continue to be a strongly contested price range.

The activity following the hardfork was completely expected by many. Without going into too much detail, the hardfork of BTC-USD can be thought of as a fracturing of its market cap — essentially, an instant reduction of BTC-USD value:

Figure_2_micro_fibs.JPGFigure 2: BTC-USD, 15Min Candles, Bitfinex, Price Drop Post-hardfork

At the moment, since BCH-USD has yet to be opened to those without coins on the major exchanges, the actual effects of the hardfork have yet to be felt (as mentioned before, the bulk of the BCH holders are currently sidelined without major outlets to sell their coins). The current prices are reflective of speculators anticipating a drop in value upon the opening of the BCH deposits and withdrawals. To date, the price activity has followed the Fibonacci Retracement values very closely. Multiple tests of the 50% retracement values were attempted before ultimately dropping down to the lower values. At the time of this article, the BTC-USD markets are attempting to test the 23% Fibonacci Retracement values.

Given the fact that BCH has yet to really sink its fingers into the BTC-USD markets, one would expect to see a test of new lows within this current bear run. With each test of the Fibonacci lines there is a swell in volume. A test of the lower boundaries of the bear run will be no exception.

It’s never easy to confidently write price projections with so much uncertainty in the markets. In an attempt to remain objective in my writing, I will just say this: Volatility is to be expected as BCH and BTC attempt to set their place in the market.

In general, when looking for reliable trends, it is almost always advisable to watch the volume trend as it correlates to price movement. When the price is erratic and appears to operating irrationally, check the volume. If there is no volume to substantiate a move, more often than not the move will be short lived. Volume establishes support and it reaffirms resistance lines. Volume also is a great indicator of market momentum and direction. When trading BTC in the coming days, volume will be your best friend.

Summary:

  1. BTC-USD showed strong support at the $2500 values in the days leading up to the hardfork.

  2. To date, the effects of the hardfork have yet to be realized because BCH deposits and withdrawals from most major exchanges haven’t be enabled.

  3. Once BCH deposits are enabled, expect high volatility on the BTC-USD markets as both coins (BTC and BCH) compete for their market cap share.

Trading and investing in digital assets like bitcoin, bitcoin cash and ether is highly speculative and comes with many risks. This analysis is for informational purposes and should not be considered investment advice. Statements and financial information on bitcoin Magazine and BTC Media related sites do not necessarily reflect the opinion of BTC Media and should not be construed as an endorsement or recommendation to buy, sell or hold. Past performance is not necessarily indicative of future results.

The post Bitcoin Price Analysis: Post-Fork Markets Await Enabling of BCH Deposits appeared first on Bitcoin Magazine.

Cryptocurrency Investors’ Happy Hour & Hor D’oeuvre!

Cryptocurrency Investors’ Happy Hour & Hor D’oeuvre! Feel lost in the cryptocurrency world? Don't know which ones to invest in? Come meet, mingle and munch with other cryptocurrency investors whether you are a novice or […]