May 26, 2026

Capitalizations Index – B ∞/21M

Top coin anchors market revival as digital silver looks to slip |

Top coin anchors market revival as digital silver looks to slip |

Top coin anchors market revival as digital silver looks to slip |

Top coin anchors market revival as digital silver looks to slip |

The collective market saw a wave of good fortune over the past week as the market cap rose to a two-week high of $143 billion.

Bitcoin, the top cryptocurrency in the market, saw a meager 0.36 percent hike against the US Dollar and was trading at $4,095, at press time. The coin’s market cap stood at $72.08 billion and still held 50.2 percent dominance in the coin market.

FCoin registered the maximum BTC trading volume, accounting for 25.97 percent of the total via the trading pair BTC/USDT. Other notable exchanges on the list were BitMEX, CoinBene, and BitForex.

Litecoin [LTC], the digital silver was riding a bull wave since the beginning of the year, with its price seeing notable highs. After being overtaken by a surging EOS, the coin slipped against the US Dollar by 0.76 percent and was trading at $60.69, at press time. Litecoin was valued at $3.71 billion, trailing EOS by over $120 million.

Coineal took the top spot in terms of LTC trade volume by holding 8.82 percent of the global volume via the trading pair LTC/BTC. Other notable exchanges on the list were FCoin, Coinall, and DigiFinex.

Bitcoin 1-day

Source: TradingView

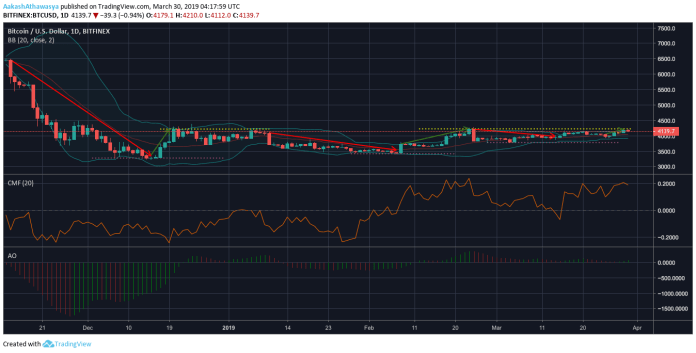
The one-day BTC chart shows the coin trading between $3,800 and $4,200 since the beginning of February. In this period, two notable trends were witnessed, the first pushed the price down from $4,215 to $3,984 and the second pushed the price from $4,030 to $4,213.

Bitcoin found immediate support at $3,781, which the top-coin was trading below during mid-February. The immediate resistance level stood at $4,226, which has persisted since the close of the previous year.

The Bollinger Bands pointed to decreasing price volatility, while the Moving Average indicated a bullish swing.

The Chaikin Money Flow tool showed a massive uptick in the money inflow into BTC tokens as the CMF line was above 0.

The Awesome Oscillator indicated a rising short-term momentum, while the concluding greens bars further suggested a bullish swing.

Litecoin 1-day:

Source: Trading View

The digital silver has been riding a bullish wave since the beginning of the year, with several uptrends dominating the coin’s one-day chart. Notable uptrends were witnessed from $45.63 to $56.78, and then from $56.54 to $61.27.

Litecoin found immediate support at $54.57, which the coin has surged above. The immediate resistance level of the coin stood at $61.34, which the coin will likely shatter with any upcoming bullish tendencies.

The Parabolic SAR pointed to a mildly bearish decline, as the dotted lines were above the coin’s trend line.

The MACD also showed bearish movement as the Signal Line was above the MACD Line.

The Relative Strength Index indicated declining investor interest as the RSI dropped from 70.38 to 59.99.

Conclusion:

A slew of positive coin announcements, regulatory updates, and adoption news has buoyed the collective market to sustain its high, while Bitcoin’s persistence above $4,000 played an anchoring role. The top cryptocurrency has seen its dominance decline over the past few months, but the bullish prospects still remain, as the indicators showed. Litecoin, however, is under bearish overwatch as the investor interest is declining and both the Parabolic SAR and MACD indicate a bearish swing.

The post Bitcoin [BTC] and Litecoin [LTC] Price Analysis: Top coin anchors market revival as digital silver looks to slip appeared first on AMBCrypto.

Published at Sun, 31 Mar 2019 03:15:29 +0000
Previous Article

We announce that we are starting an Exclusive Alpha Version of the ELITE Emissaries Program

Next Article

Facebook’s Cryptocurrency Won’t Let You Buy Your Privacy Back

You might be interested in …

Bitcoin Price Analysis: Post-Fork Markets Await Enabling of BCH Deposits

Bitcoin Price Analysis

As expected, the events leading up to the BTC hardfork were dramatic. Before splitting off with its hardfork counterpart (bitcoin Cash), BTC-USD saw drastic swings in price with wildly different market values, depending on the exchange. While some exchanges saw new all-time highs being achieved (Kraken BTC-USD), others began to see discounts in their BTC-USD values. At points, there were even $100+ premiums between Kraken and Bitfinex.

At time of this article, bitcoin Cash (BCH) markets on most major exchanges have existed in a bubble as BCH deposits and withdrawals have been halted. There are many theories regarding the isolation of exchanges and their corresponding BCH-USD markets’ effects on the BTC-USD markets. Given this bit of information, one can assume that the dramatic rise in BCH market cap is unreliable at the moment. There is a large portion of the bitcoin community that is unable to sell its forked BCH and is currently sidelined. As such, this analysis will only take a look at BTC-USD price trend and what we can expect there.


Want to learn how to claim your BCH? Find out here.


Looking at the macro trend of the BTC-USD market, we can see that a previous test of the 23% Fibonacci Retracement values was strongly tested and subsequently rejected in the days leading up to the hardfork:

Figure_1_Macro_Fibs.JPGFigure 1: BTC-USD, 12HR Candles, Bitfinex, Macro Fibonacci Retracement Lines

The $2500 values have proven to be a formidable foe for those looking to the short the market, and last week was no exception. To date, $2500 values have built a strong level of support over the past couple months and will continue to be a strongly contested price range.

The activity following the hardfork was completely expected by many. Without going into too much detail, the hardfork of BTC-USD can be thought of as a fracturing of its market cap — essentially, an instant reduction of BTC-USD value:

Figure_2_micro_fibs.JPGFigure 2: BTC-USD, 15Min Candles, Bitfinex, Price Drop Post-hardfork

At the moment, since BCH-USD has yet to be opened to those without coins on the major exchanges, the actual effects of the hardfork have yet to be felt (as mentioned before, the bulk of the BCH holders are currently sidelined without major outlets to sell their coins). The current prices are reflective of speculators anticipating a drop in value upon the opening of the BCH deposits and withdrawals. To date, the price activity has followed the Fibonacci Retracement values very closely. Multiple tests of the 50% retracement values were attempted before ultimately dropping down to the lower values. At the time of this article, the BTC-USD markets are attempting to test the 23% Fibonacci Retracement values.

Given the fact that BCH has yet to really sink its fingers into the BTC-USD markets, one would expect to see a test of new lows within this current bear run. With each test of the Fibonacci lines there is a swell in volume. A test of the lower boundaries of the bear run will be no exception.

It’s never easy to confidently write price projections with so much uncertainty in the markets. In an attempt to remain objective in my writing, I will just say this: Volatility is to be expected as BCH and BTC attempt to set their place in the market.

In general, when looking for reliable trends, it is almost always advisable to watch the volume trend as it correlates to price movement. When the price is erratic and appears to operating irrationally, check the volume. If there is no volume to substantiate a move, more often than not the move will be short lived. Volume establishes support and it reaffirms resistance lines. Volume also is a great indicator of market momentum and direction. When trading BTC in the coming days, volume will be your best friend.

Summary:

  1. BTC-USD showed strong support at the $2500 values in the days leading up to the hardfork.

  2. To date, the effects of the hardfork have yet to be realized because BCH deposits and withdrawals from most major exchanges haven’t be enabled.

  3. Once BCH deposits are enabled, expect high volatility on the BTC-USD markets as both coins (BTC and BCH) compete for their market cap share.

Trading and investing in digital assets like bitcoin, bitcoin cash and ether is highly speculative and comes with many risks. This analysis is for informational purposes and should not be considered investment advice. Statements and financial information on bitcoin Magazine and BTC Media related sites do not necessarily reflect the opinion of BTC Media and should not be construed as an endorsement or recommendation to buy, sell or hold. Past performance is not necessarily indicative of future results.

The post Bitcoin Price Analysis: Post-Fork Markets Await Enabling of BCH Deposits appeared first on Bitcoin Magazine.