May 31, 2026

Capitalizations Index – B ∞/21M

THE END OF THE BITCOIN RALLY!

The end of the bitcoin rally!

THE END OF THE BITCOIN RALLY!

The end of the bitcoin rally!

Hi fellow traders!

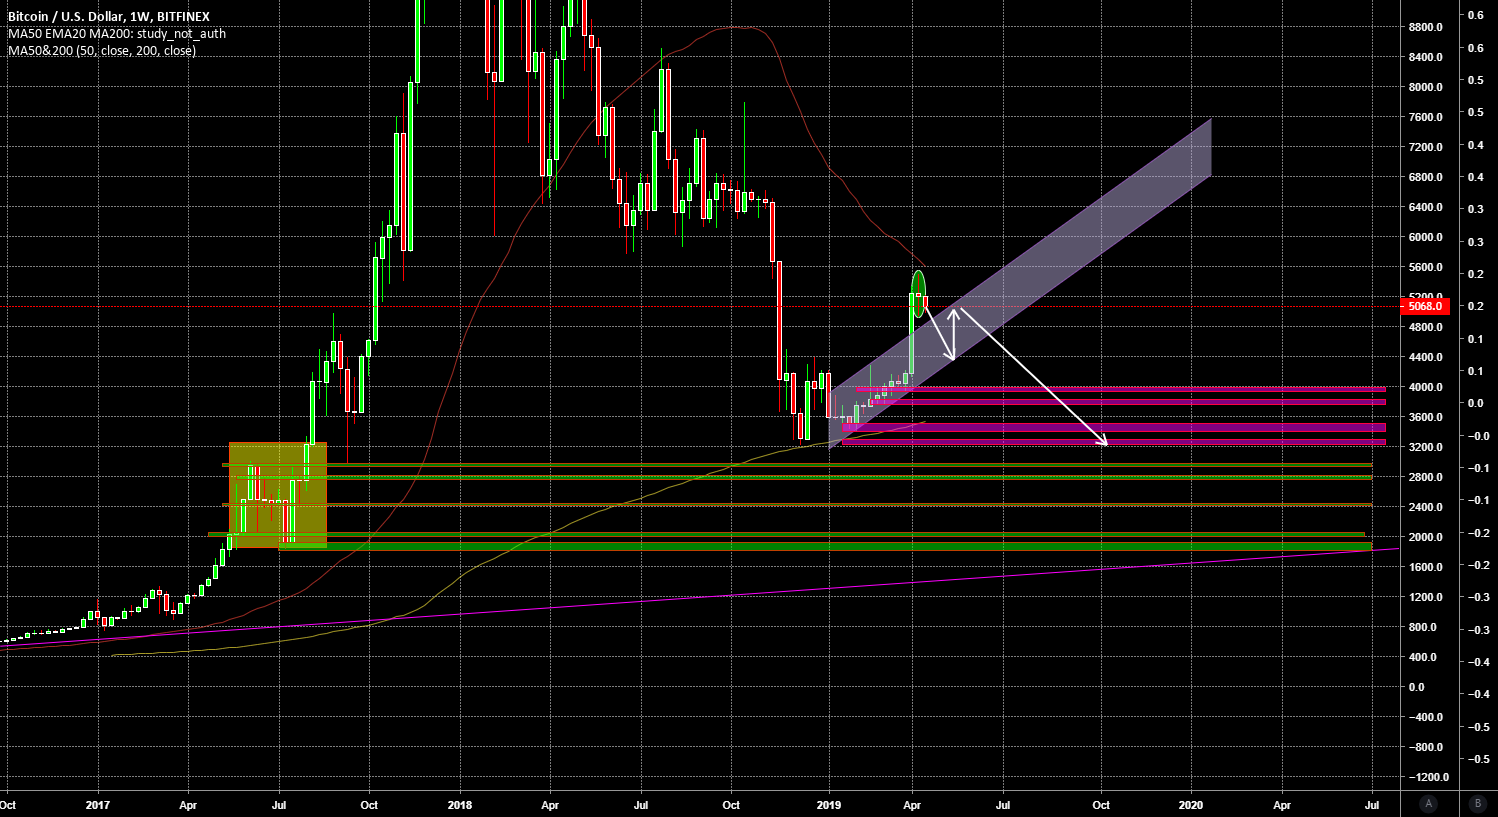
We have recently seen BTCUSD rally over the past couple of days after breaking out of a consolidation zone. This has led to a rally of BTC approaching around $5500 USD at its peak.
Looking at BTC now on a weekly time frame, a doji star has been printed – to be specific, an enormous evening doji star (highlighted in green).
This is a sign of a bearish reversal and looking at BTCUSD and its rally over the past couple of weeks, I think the time has come, as from my last article for this pair to drop .
Furthermore, considering this pair in terms of moving averages, the 50MA is acting as a resistance for this pair, which should help to aid this pair to the downside.
The 50MA should act as a heavy resistance barrier for the bulls to break out from the long-term bearish trend .
Considering this pair will drop over the next few weeks, I think we will firstly see price re-enter the parallel channel , test this channel a few times, before rejecting into the highlighted zones in pink.
I think after these pink highlighted zones are tested and broken as floors of support, we could look to see a surge to the upside for some time, but then a retracement to the significant lower end support levels highlighted in yellow, where I think the price of BTCUSD could head over the next couple of months to a year before we see the next proper bull run.

If you haven’t already read my last article on the long term forecast of BTC , check my profile to find my last post about the future of BTC .

If you read it to all the way down here, thanks for showing some support to this article! Tell me where you think BTC and Cryptos are heading next! Comment below all your ideas about the future of cryptocurrencies! Buy or Sell and why? Additionally, drop me your charts for it, that’d be great so I can see where you are coming from. I’m a new guy to the FX & Crypto market, trying to learn FX & Crypto, and I’d appreciate any help people may offer!

Please drop a follow! I need reputation points!!

Published at Tue, 16 Apr 2019 13:41:20 +0000

Previous Article

Dave Hodgson of NEM Ventures interview

Next Article

Bitcoin Campaign Launched in Effort To Rebuild Notre Dame

You might be interested in …

Bitcoin Gold Price Technical Analysis – BTG/USD Preparing for Next Break

Key Points

  • bitcoin gold price has recovered well from the $205 support zone against the US Dollar.
  • There is a contracting triangle forming with current resistance at $255 on the hourly chart of BTG/USD (data feed from Bitfinex).
  • The pair might make the next move soon either above $255 or below $235 in the near term.

bitcoin gold price is moving nicely above $200 against the US Dollar. BTG/USD is now preparing for the next break with resistance at $255.

bitcoin Gold Price Resistance

Recently, we saw a declining pattern in bitcoin gold price from the $300 swing high against the US Dollar. The price traded below the $280 and $250 support levels and moved closer to the $200 handle. A low was formed at $207 from where the price started an upside recovery. It has moved above the 50% Fib retracement level of the last decline from the $275 high to $207 low.

However, the price is struggling to move above the $260 resistance level. Moreover, the 61.8% Fib retracement level of the last decline from the $275 high to $207 low also prevented gains. It seems like there is a contracting triangle forming with current resistance at $255 on the hourly chart of BTG/USD. The triangle resistance at $255-260 is a major hurdle for buyers. On the positive side, the price is currently above $240 and the 100 hourly simple moving average.

Bitcoin Gold Price Technical Analysis BTG USD

On the downside, there is a connecting trend line with support at $240. Therefore, it seems like the pair is approaching a breakout either above $255 or below $235. Above $255-260, the price could trade higher towards the $300 level. On the other hand, below $235, the price could retest $200.

Looking at the technical indicators:

Hourly MACD – The MACD for BTG/USD is slowly moving in the bullish zone.

Hourly RSI (Relative Strength Index) – The RSI for BTG/USD is moving higher towards the 70 level.

Major Support Level – $235

Major Resistance Level – $260


Charts courtesy – Trading View, Bitfinex

The post Bitcoin Gold Price Technical Analysis – BTG/USD Preparing for Next Break appeared first on NEWSBTC.