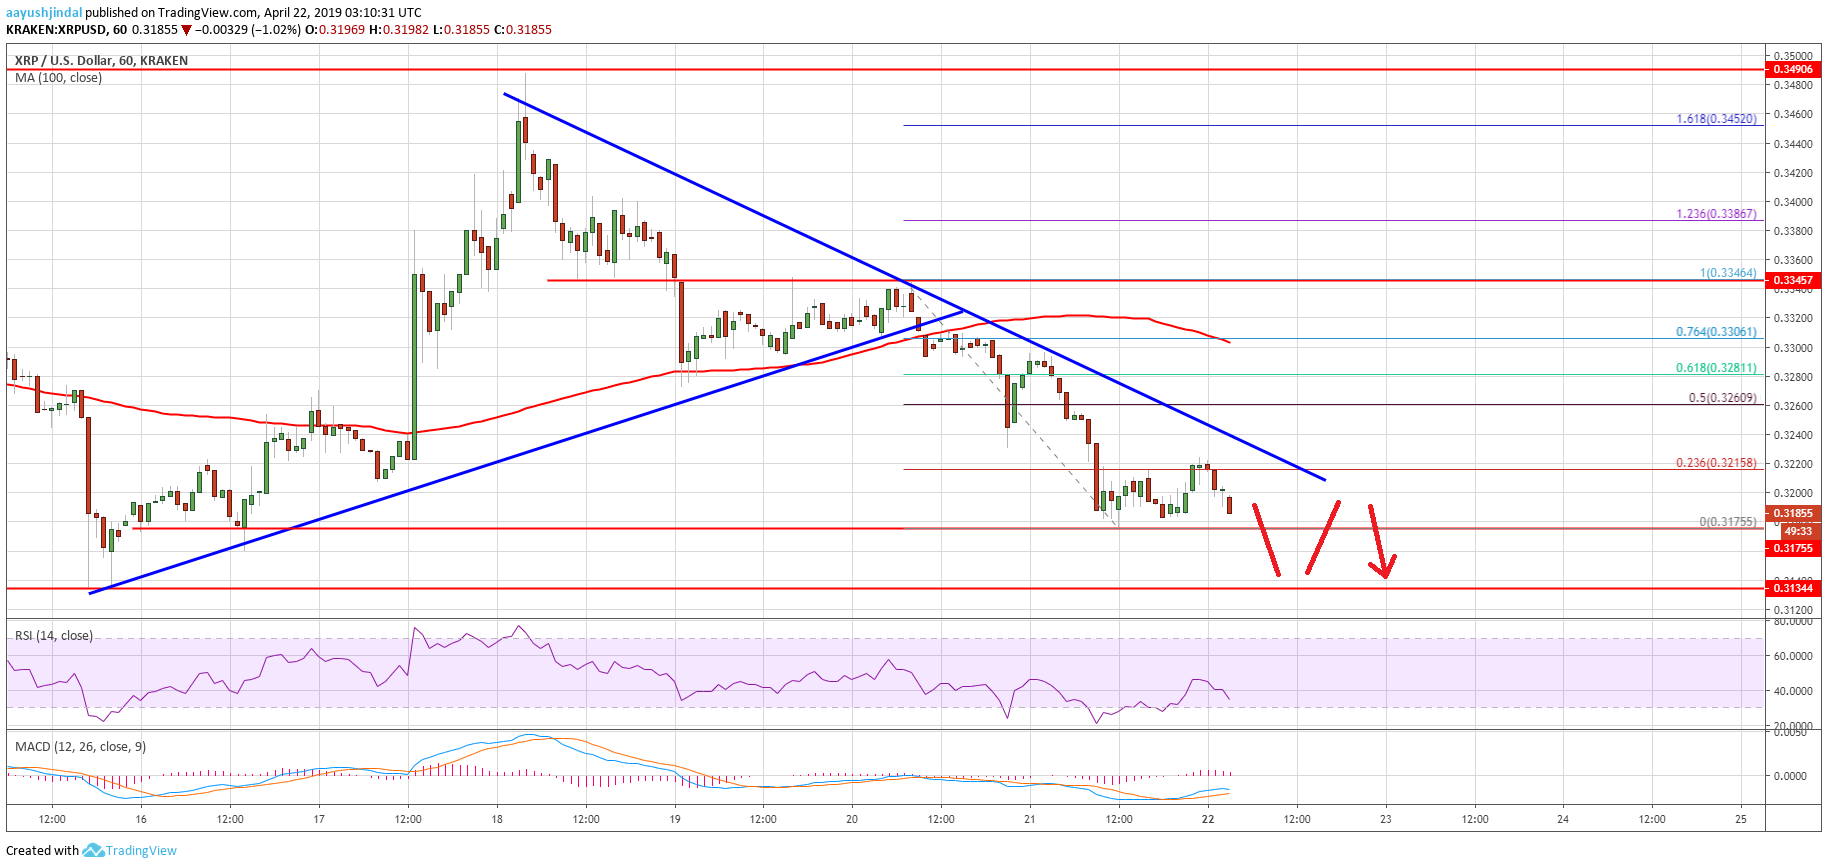
- Ripple price failed to gain strength above the $0.3350 resistance area against the US dollar.
- The price broke the $0.3280 and 0.3250 support levels to move into a bearish zone.
- There was a break below a major bullish trend line with support at $0.3320 on the hourly chart of the XRP/USD pair (data source from Kraken).
- The pair remains at a risk of more losses if the bulls fail to defend the $0.3130 support area.
price is under a lot of selling pressure against the US Dollar and . XRP must stay above the $0.3130 support level to bounce back in the near term.
Ripple Price Analysis
After forming a swing low at $0.3134 low, price climbed higher above $0.3250 and $0.3280 against the US Dollar. The XRP/USD pair even broke the $0.3320 resistance area and the 100 hourly simple moving average. The price finally pumped towards the $0.3500 resistance, where sellers defended more gains. A high was formed at $0.3490 and later the price started a major drop. The price started consolidating losses and later failed to climb back above the $0.3350 resistance area.
As a result, there was a sharp decline below the . There was even a close below the $0.3280 level and the 100 hourly simple moving average. Besides, there was a break below a major bullish trend line with support at $0.3320 on the hourly chart of the XRP/USD pair. Bears pushed the price below $0.3200 and a swing low was formed near $0.3175. It recently corrected higher above $0.3200. However, the price struggled to fail near the $0.3215 level and the 23.6% Fib retracement level of the recent slide from the $0.3346 high to $0.3175 low.
More importantly, there is a bearish trend line formed near $0.3225 on the same chart. A proper close above the trend line and $0.3250 is must for a fresh increase. The next key resistance is at $0.3260 and the 50% Fib retracement level of the recent slide from the $0.3346 high to $0.3175 low. Finally, the 100 hourly SMA is near $0.3300 to act as a major hurdle for buyers.
Looking at the , price is clearly in a bearish zone below $0.3225 and $0.3250. There is a risk of more losses below $0.3150. However, the $0.3130 level hold the key, below which the price could decline sharply to $0.3000.
Technical Indicators
Hourly MACD – The MACD for XRP/USD is slowly moving in the bullish zone.
Hourly RSI (Relative Strength Index) – The RSI for XRP/USD declined below the 50 level, with a bearish angle.
Major Support Levels – $0.3150, $0.3130 and $0.3000.
Major Resistance Levels – $0.3225, $0.3250 and $0.3300.
Published at Mon, 22 Apr 2019 05:49:40 +0000