Key Highlights
- Ripple price formed support near the $0.7500 level and recovered recently against the US dollar.
- There was a break above a declining channel with resistance at $0.8000 on the hourly chart of the XRP/USD pair (data source from Kraken).
- The pair must clear the 100 hourly simple moving average and $0.8600 resistance to gain traction.
Ripple price is recovering with a bullish angle against the US Dollar and bitcoin. XRP/USD needs to settle above $0.8600 to extend gains in the near term.
Ripple Price Resistance
After a , Ripple price formed a support base near the $0.7500 level against the US Dollar. The price started an upside wave and recovered above the $0.7800 resistance. The recovery was positive since the price moved above the 23.6% Fib retracement level of the last drop from the $0.9640 swing high to $0.7500 swing low. It ignited more upsides and the price moved above $0.8200.
During the upside move, there was a break above a declining channel with resistance at $0.8000 on the hourly chart of the XRP/USD pair. Therefore, it seems like the recent break above $0.8080 and $0.8200 is positive above $0.8080 and $0.8200. At the moment, the price is struggling to break a previous support at $0.8500. Moreover, the 100 hourly SMA is positioned near $0.8550. Lastly, the 50% Fib retracement level of the last drop from the $0.9640 swing high to $0.7500 swing low is near $0.8600 to .
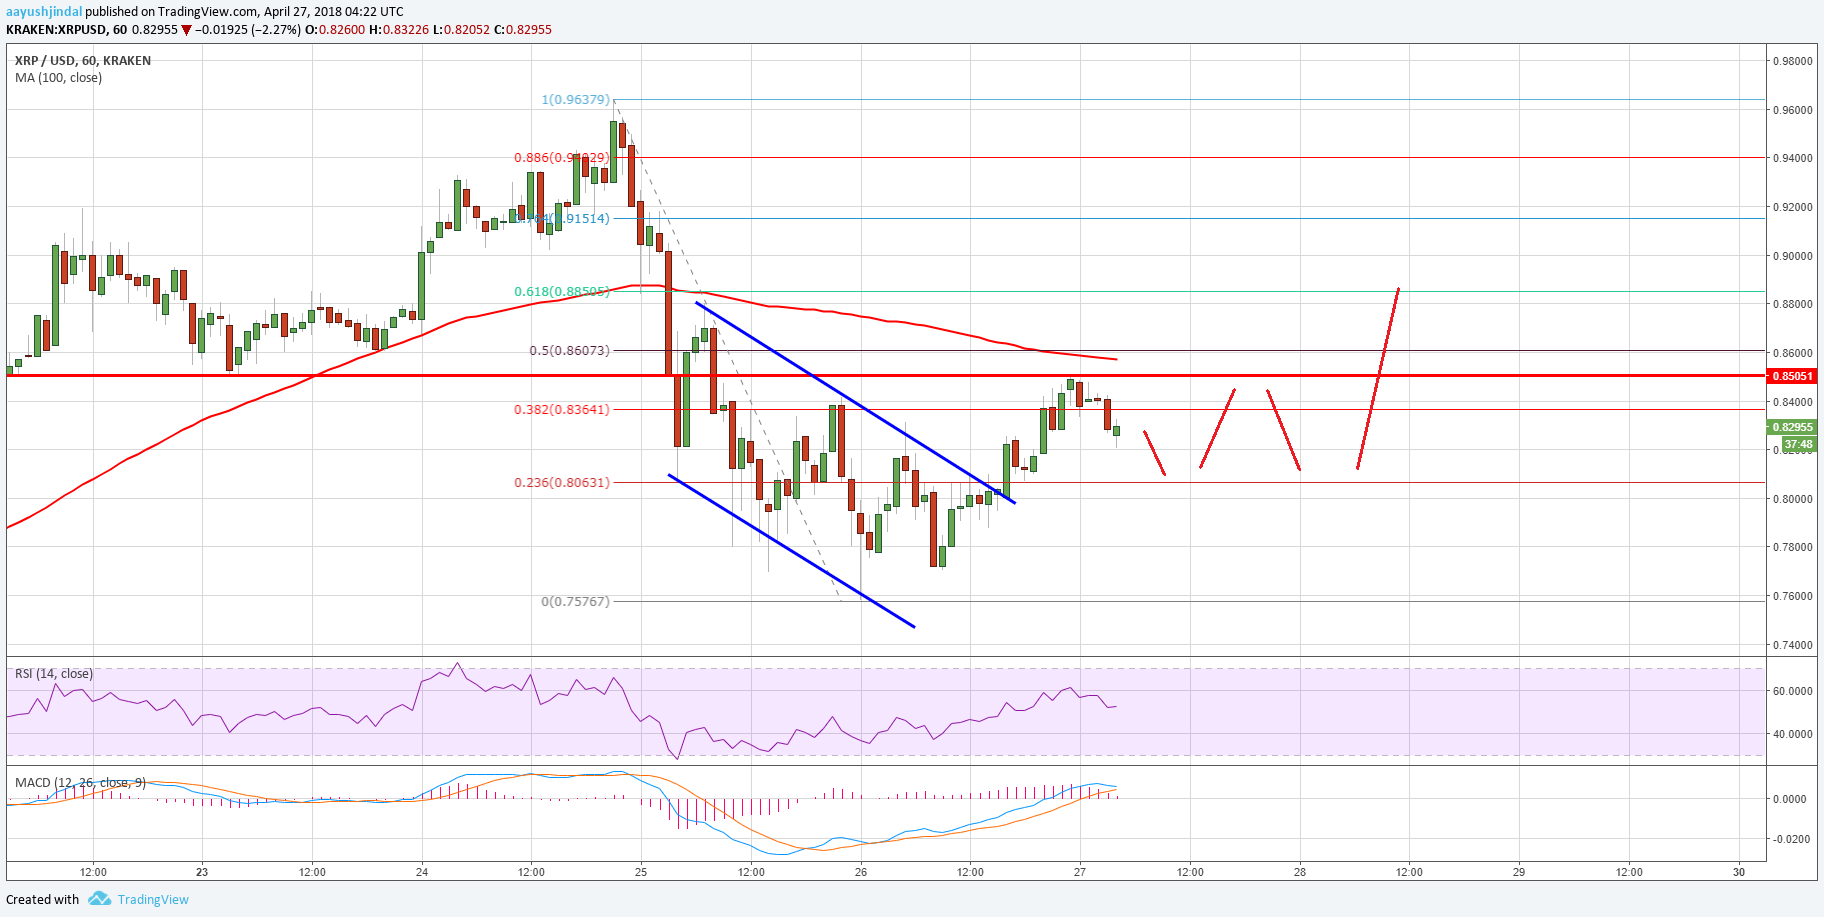
Looking at the , the price has to clear the $0.8500, 100 hourly SMA and $0.8600 to gain further. A successful close above the $0.8600 resistance may open the doors for a push towards $0.8900. On the downside, supports area t $0.8200 and $0.8080.
Looking at the technical indicators:
Hourly MACD – The MACD for XRP/USD is slightly in the bullish zone.
Hourly RSI (Relative Strength Index) – The RSI for XRP/USD is currently just above the 50 level.
Major Support Level – $0.8080
Major Resistance Level – $0.8600
Published at Fri, 27 Apr 2018 06:30:59 +0000
Analysis