Local Authorities Approve Lease For Bitmain Subsidiary In Rural Washington
Port of Walla Walla, Washington commissioners have unanimously agreed to embark on a land lease and purchase option for 10 acres to be used for cryptocurrency project by Bitmain subsidiary Ant Creek LLC, local news April 13.
The decision to award the permit followed an hour and a half of spirited public debate, after which the commissioners unanimously agreed to award the option for 10 acres, but withheld the option for the sale of 30 additional acres.
The commissioners said that the small scale operation will give Ant Creek LLC a chance to establish itself and test whether or not their business has potential for expansion in the are. The commissioners added that it would also give the project time to earn the support of the public.
The main concern of opponents to the project is the massive amount of electricity that Ant Creek will consume. Many present at the hearing felt that the 25-35 permanent jobs promised by the operation were outweighed by the fact that the project would draw the power equivalent of 24,000 residences. One resident said, “It extracts electricity and creates wealth for the owner with no trickle down.”
Columbia Rural Electric Association CEO Les Tell told commissioners that the membership-owned electric co-op has more than enough capacity to meet demand for the project, “No matter what happens a year from now or five years from now, we are fully protected.”
The project meets the Port’s mission of job and tax creation: the lease value i.e. base rent plus a 12.84 percent state leasehold tax would be $4,701 per month. Ant Creek would also pay for a $2.5 mln roadway to provide access to the property.
The Union Bulletin reports that it is unknown whether the new 10 acre plan will move ahead, stating that the altered terms of the proposal would need to be approved by the applicant. Ant Creek’s director of operations Jeff Stearns reportedly left the meeting “without a hint of whether the terms might be acceptable.”
Earlier this month, the Chelan Public Utility District, also in Washington, , of unauthorized crypto mining operations. There is currently a moratorium in effect on mining operations in that area while local officials consider the implications of opening up to further development of the industry.
4 Examples bitcoin is Now a More Mature Asset Than in 2017 Remember when the slightest bit of negative or positive development would cause the bitcoin price action to change drastically? Well, those days seem […]
YouTube: bitcoin Stock Market, bitcoin & Gold Analysis February 9 2018 Learn how to trade stocks and receive more intraday trading tips at http://www.alphatrends.net/. Learn exactly how to become a trader and achieve success in […]
Remember that time I said BTC-USD likely won’t see a new all time high (ATH) any time soon? Looks like I was wrong. Shortly after posting my previous BTC-USD analysis, in a matter of one hour, the price of BTC-USD not only broke its record high, but it surpassed it by $200 after ultimately settling in the $3200s. As of this morning, BTC-USD pushed another ATH of $3440 on Bitfinex marking a $600+ in less than a week. Let’s take a look at what these moves can possibly mean for BTC-USD and if these moves are sustainable.
Starting in the $160s, BTC-USD has been on a massive, multi-year bull run:
Figure 1: BTC-USD, 3 Day Candles, Bitfinex, Macro Bull Trend
If we plot the trend using $3440 as the top of this trend, a lot of historic support and resistance levels start to make a lot more sense within the context of the market. Our move to the $1800s marked a test of the 50% retracement line, our battle over the $2600s marked the various tests of the 23.6% retracement line and now our ultimate sudden rush to new highs can be seen as the 100% retracement line.
Keeping the same Fibonacci Retracement Lines and zooming into our daily trend, a few observations immediately pop out:
Figure 2: BTC-USD, 1 Day Candles, Bitfinex, Macro Bull Trend, Zoomed In
There is an obvious price increase on the long-term trend;
Our recent run from $1800, however, has seen decreasing volume on every leg up;
The multi-period MACD and current MACD histogram both show Bearish Divergence; and
The RSI is showing Bearish Divergence.
If we take a closer look to the market post-$1800s, we see a similar trend of divergence even on the smaller timescales:
Figure 3: BTC-USD, 6 Hour Candles, Bitfinex, Current ATH
The uptrend in price is, once again, accompanied on decreasing volume;
The 6HR is strongly diverging bearishly;
The RSI is showing strong bearish divergence; and
The 6HR Bollinger Bands show several candles fully formed outside the upper band (shown in the circle).
For those who are unfamiliar with Bollinger Bands: Simply put, they are a strong tool used to visualize market volatility. Typically, when a market is near the edge of the upper band, it is considered “overbought,” and when it nears the edge of the lower band it is considered “oversold.” When a market punctures a band it will typically yield a pullback to a trend within the bands, and when a candle is completely formed outside the bands it is usually a strong sell or buy signal — a sell signal in our case. You can think of the Bollinger Bands like a set of rubber bands: the tighter you stretch a rubber band, the harder the reaction. Typically, this is the case for markets that puncture the bands and especially for those that fully form candles outside the bands.
Looking at our current Bollinger Band trend, one might be tempted to say, “BTC-USD appears to be pulling back within the 6-Hour Bands — looks like a healthy move upward is still in the cards.” However, if we zoom out and look back through the history of BTC-USD and its interaction with the 1-Day Bollinger Bands, we can see a clear market trend.
Figure 4: BTC-USD, 1 Day Candles, Bitfinex, Bollinger Band Trend
Above are several historic examples of BTC-USDs reaction to a puncturing of the 1-Day Bollinger Bands. More often than not, a puncturing of the bands — whether the lower or upper band — is greeted with a market pullback. The stronger the break of the bands, the stronger the pullback. The strongest breaks of the bands have a very strong tendency to return to the middle line of the Bollinger Bands (the dashed line) before continuing its trend up or down.
If there is so much damning evidence of a pullback, why does the price keep rising? Fear of Missing Out (FOMO) is unpredictable and irrational. FOMO can push markets well beyond what Technical Analysis can predict and often defies market indicator signals. With all the hype surrounding the recent hard fork, and the influx of money coming from people cashing out their bitcoin Cash where does this leave us? There is a mountain of evidence suggesting this market level is unhealthy and highly overextended; it needs either to consolidate considerably or retrace. BTC-USD is tightly wound and there is very little, if any, sign of health within its most recent market moves.
I’m not saying the market won’t continue to the pump even higher than it is currently — Goldman Sachs has a price target of $3600, after all. However, with each hike in the BTC-USD price, we are increasing the likelihood of a strong pullback and ultimately a return to the center of the Bollinger Bands.
Summary:
On all relevant timescales, BTC-USD is showing strong signs of an overextended market.
The Bollinger Bands have several candles fully formed outside the upper bands on the 6 HR, 12 HR and 1 Day Candles.
Historically, when the 1 Day Bollinger Bands are punctured, there is a market pullback.
Trading and investing in digital assets like bitcoin, bitcoin cash and ether is highly speculative and comes with many risks. This analysis is for informational purposes and should not be considered investment advice. Statements and financial information on bitcoin Magazine and BTC Media related sites do not necessarily reflect the opinion of BTC Media and should not be construed as an endorsement or recommendation to buy, sell or hold. Past performance is not necessarily indicative of future results.


 Figure 1: BTC-USD, 3 Day Candles, Bitfinex, Macro Bull Trend
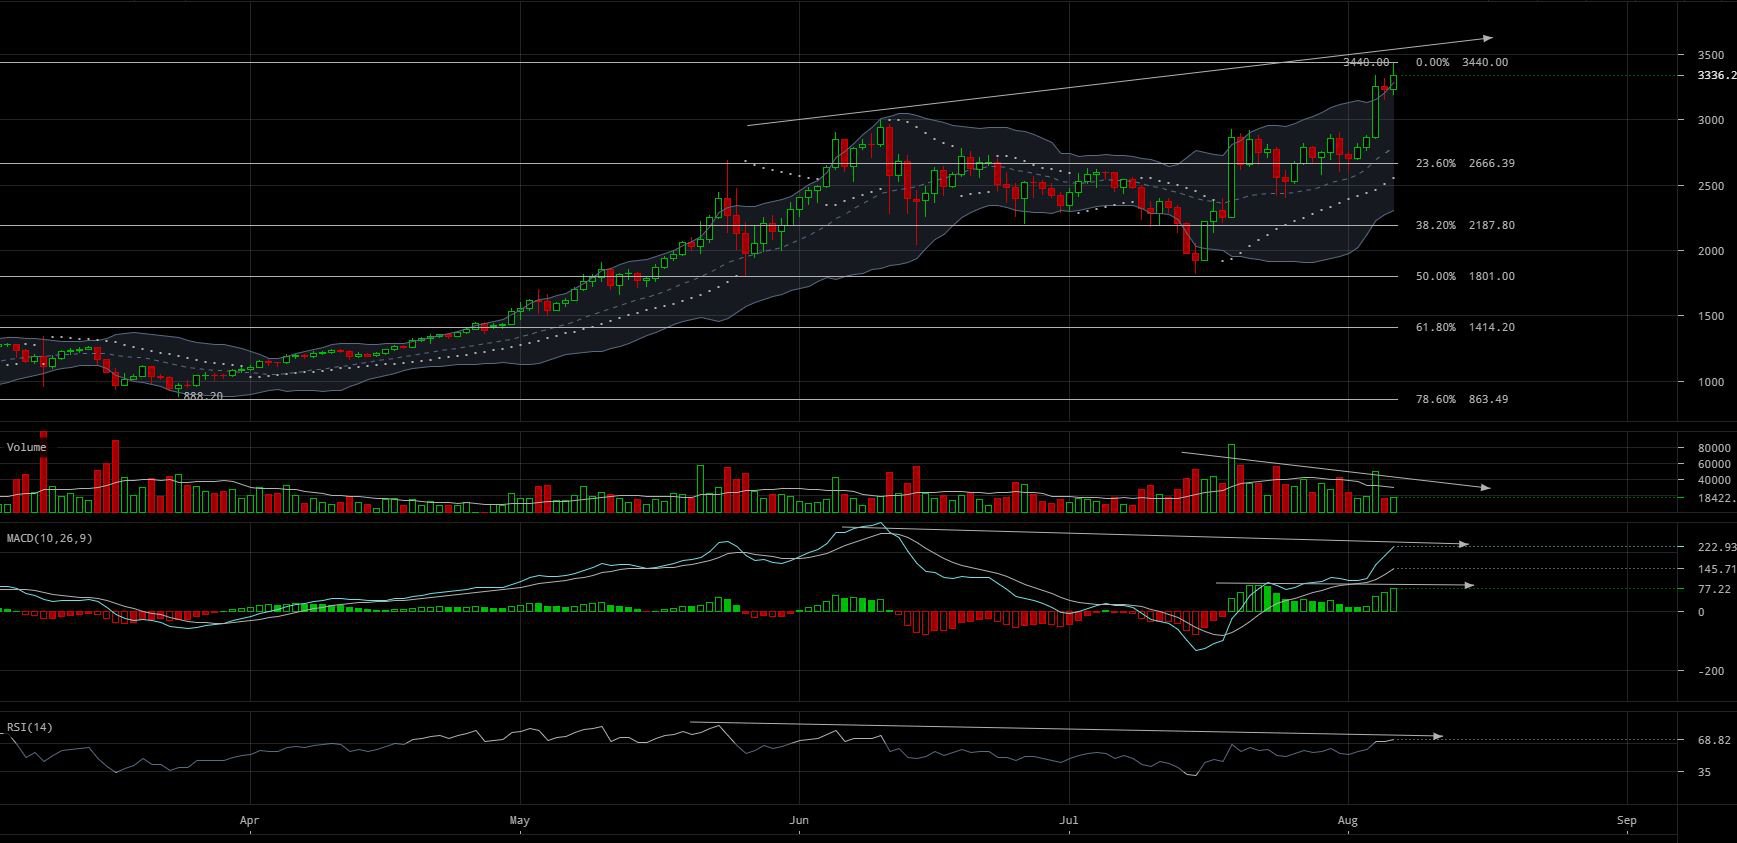 Figure 2: BTC-USD, 1 Day Candles, Bitfinex, Macro Bull Trend, Zoomed In
 Figure 3: BTC-USD, 6 Hour Candles, Bitfinex, Current ATH
 Figure 4: BTC-USD, 1 Day Candles, Bitfinex, Bollinger Band Trend
