Key Highlights
- ETH price moved higher and was successful in breaking a major resistance near $390-395 against the US Dollar.
- Yesterday’s highlighted major bearish trend line with resistance at $395 was breached on the hourly chart of ETH/USD (data feed via Kraken).
- The pair traded above the $415 level before starting a downside correction recently.
Ethereum price is showing a few positive signs against the US Dollar and bitcoin. ETH/USD remains supported on the downside around the $400 and $395 levels.
Ethereum Price Support
There was a to an upside wave from the $370 level in ETH price against the US Dollar. The price gained momentum and it was able to break a major resistance near the $390-395 zone. It also cleared the 50% Fib retracement level of the last decline from the $430 high to $360 low. It opened the doors for more gains and the price moved above the $400 level.
More importantly, yesterday’s highlighted major bearish trend line with resistance at $395 was breached on the hourly chart of ETH/USD. The pair traded as high as $417.84 before it faced sellers. Later, a downside correction was initiated and the price moved below $410. It also traded below the 23.6% Fib retracement level of the last wave from the $359 low to $417 high. However, there is a major support near the $400 level and the 100 .
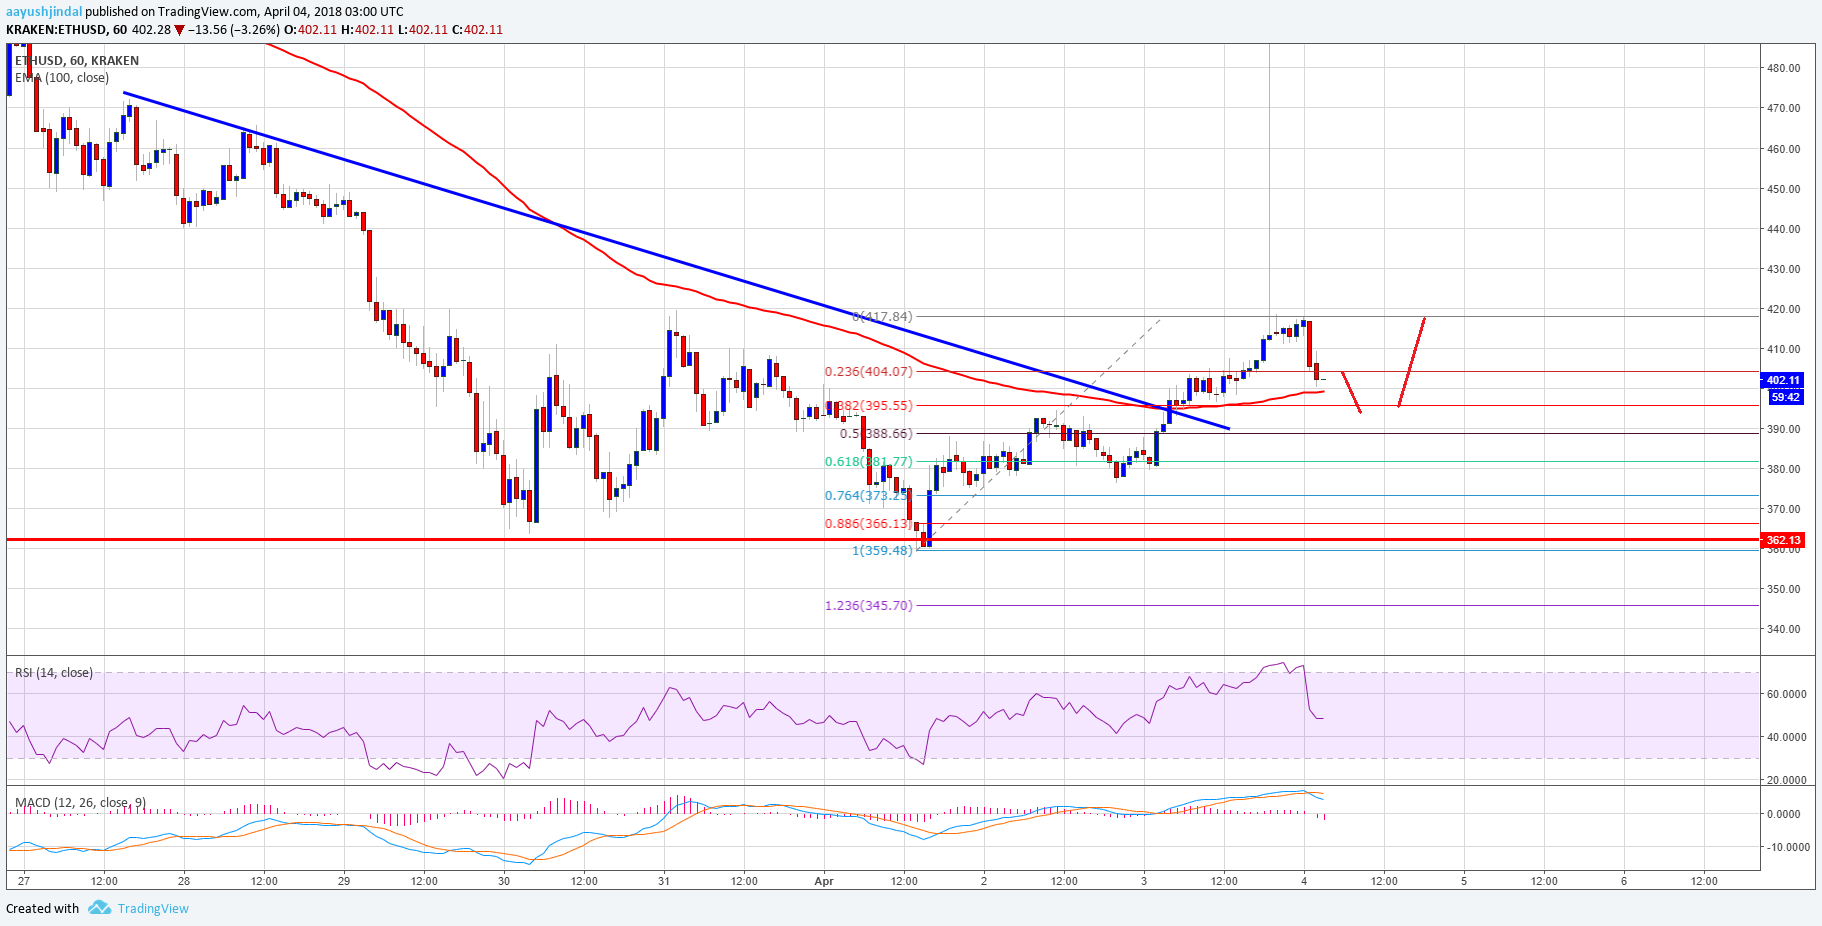
Furthermore, the 38.2% Fib retracement level of the last wave from the $359 low to $417 high may also act as a support around the $395 level. If the price fails to stay above the $395 and $390 supports, there could be a retest of $360. On the upside, the price has to move past $317-320 zone for more gains in the near term.
Hourly MACD – The MACD is moving back in the bearish zone.
Hourly RSI – The RSI is moved back below the 50 level.
Major Support Level – $390
Major Resistance Level – $417
Charts courtesy –
Published at Wed, 04 Apr 2018 05:00:25 +0000
Analysis