September 11, 2026

Capitalizations Index – B ∞/21M

Bitcoin Stays Over $3,600 as Most Top Cryptos See Slight Gains

Bitcoin stays over $3,600 as most top cryptos see slight gains

Bitcoin Stays Over $3,600 as Most Top Cryptos See Slight Gains

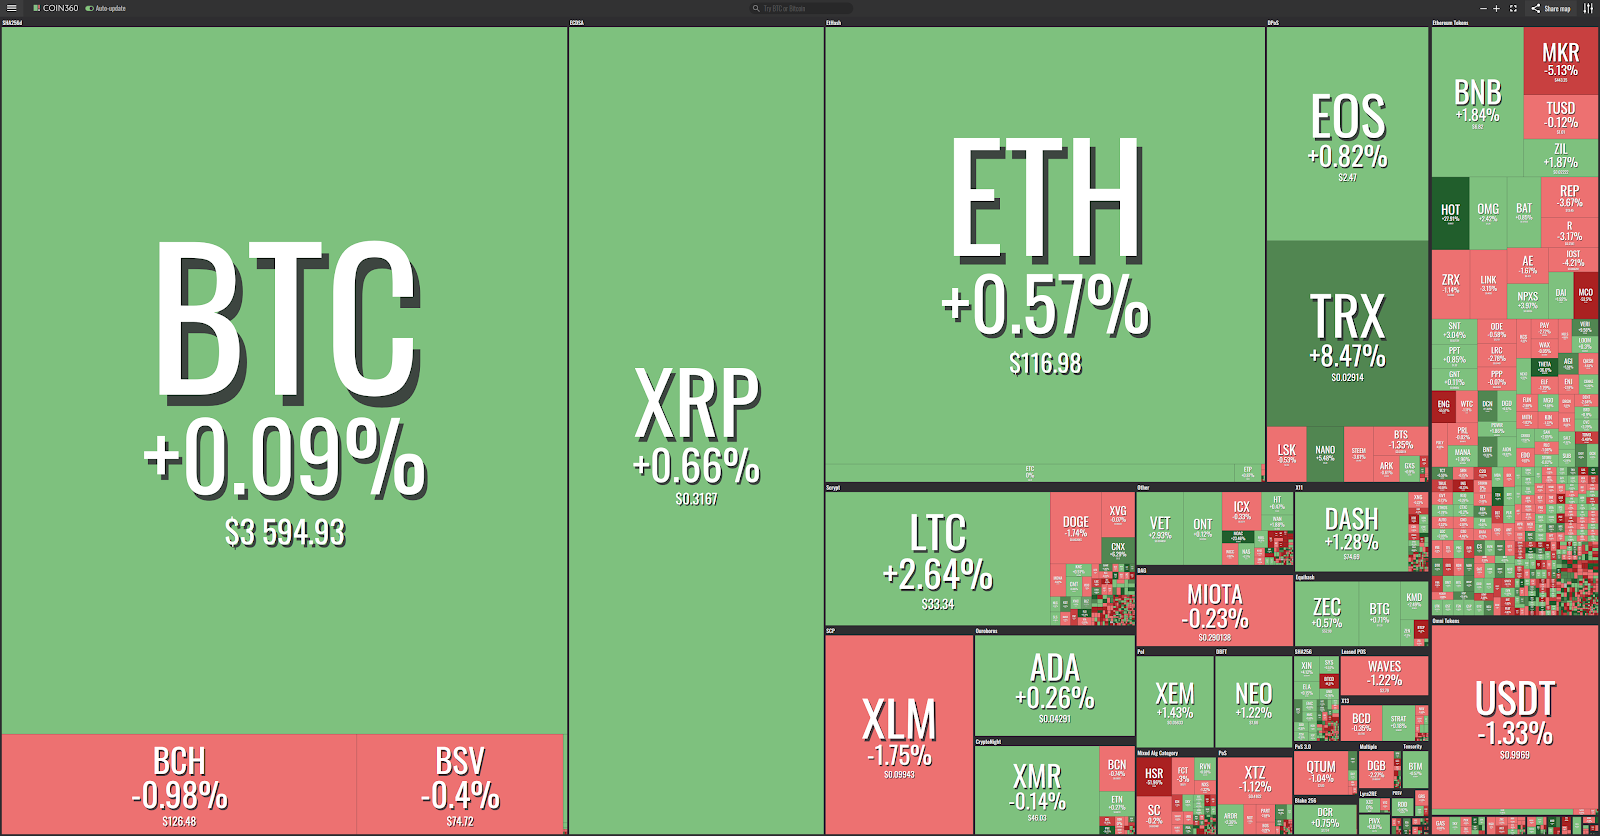
Saturday, Jan. 26 — most of the top 20 cryptocurrencies are reporting slight gains on the day to press time. bitcoin (BTC) is hovering over $3,600 again, according to Coin360 data.

Market visualization from coin360

Market visualization from Coin360

At press time, bitcoin is seeing no significant price change on the day, trading at around $3,607, according to CoinMarketCap. Looking at its weekly chart, the current price is lower than $3,745, the price at which bitcoin started the week.
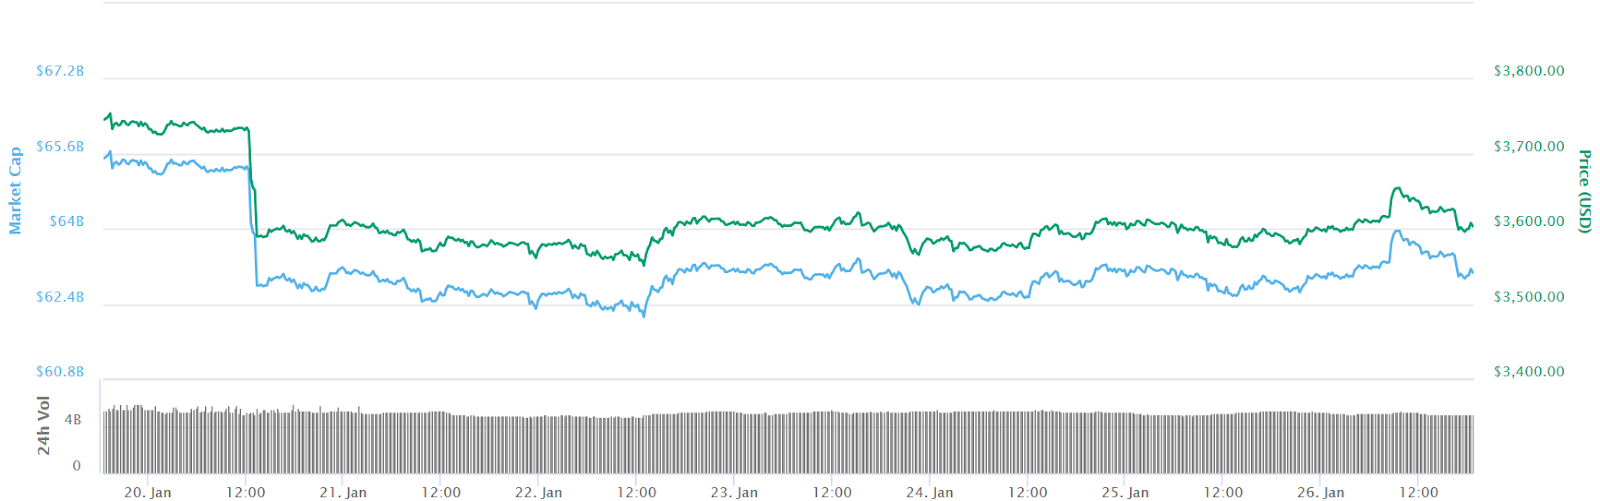
Bitcoin 7-day price chart

bitcoin 7-day price chart. Source: CoinMarketCap

Ripple (XRP) has seen its value undergo little change in the 24 hours to press time, trading at around $0.316, gaining little over half a percent on the day. On its weekly chart, the current price is lower than $0.332, the price at which XRP started the week.
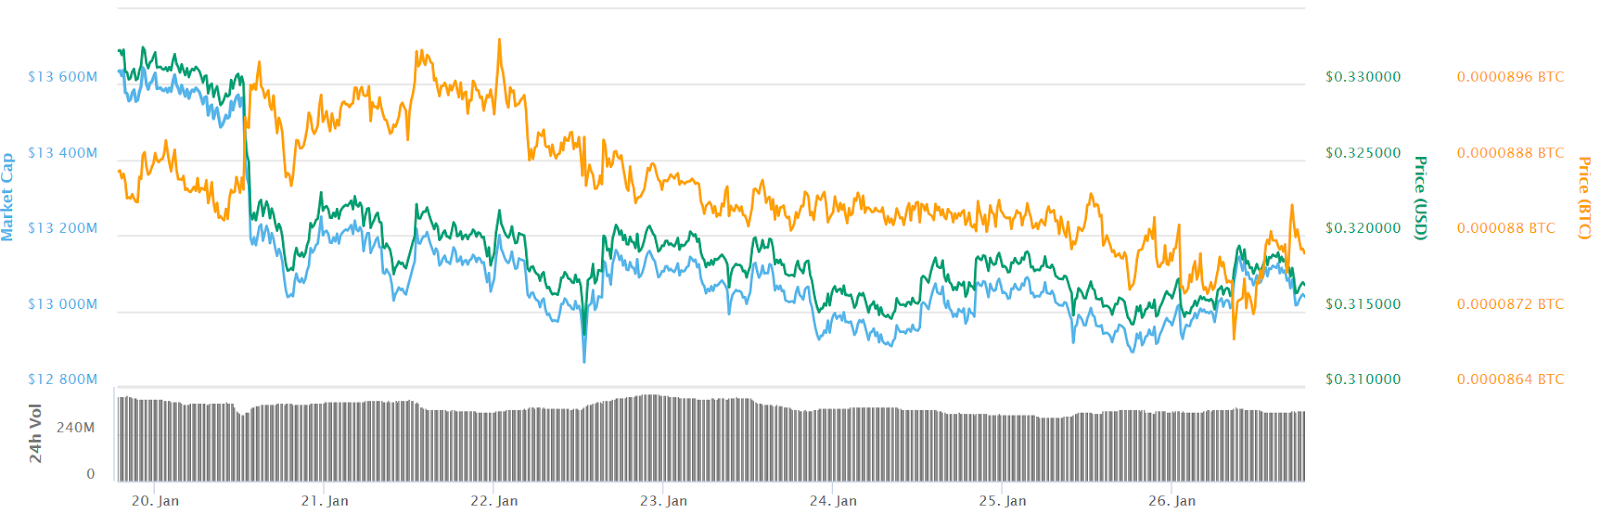
Ripple 7-day price chart

Ripple 7-day price chart. Source: CoinMarketCap

Second-largest altcoin Ethereum (ETH) has also seen its value increase by over half of a percent over the last 24 hours. At press time, ETH is trading at $117, having started the day about one dollar lower. On the weekly chart, Ethereum’s current value is lower than $125, the price at which the coin started the week.
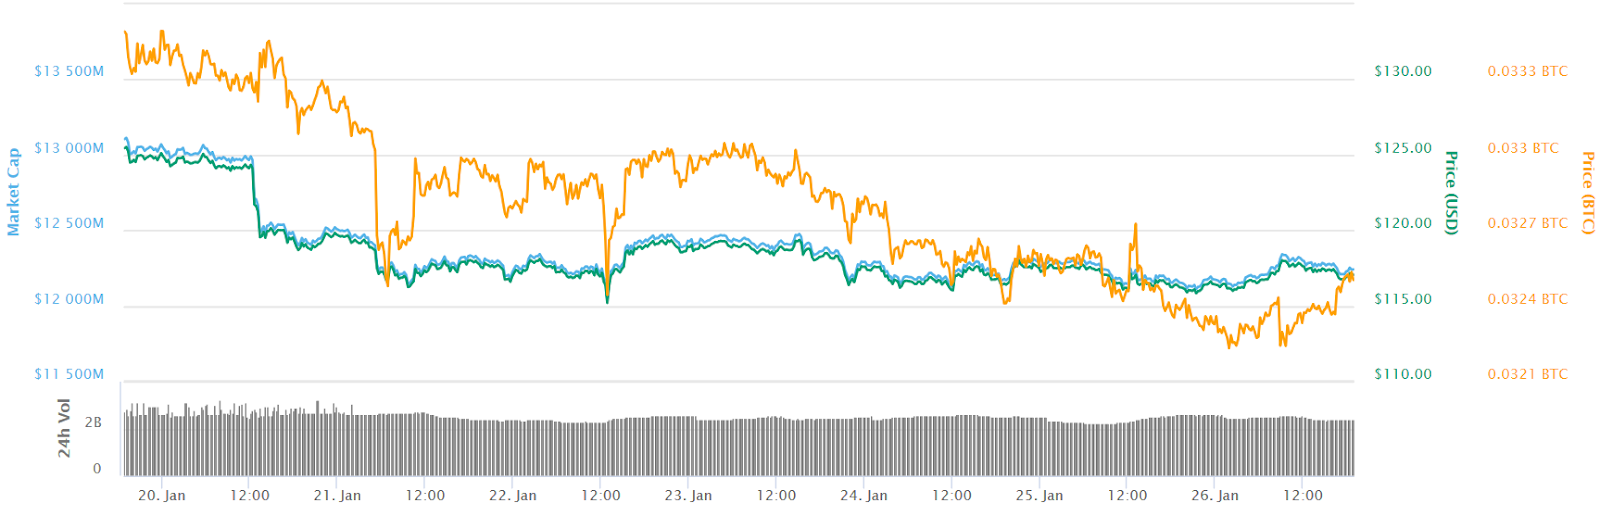
Ethereum 7-day price chart

Ethereum 7-day price chart. Source: CoinMarketCap

Among the top 20 cryptocurrencies, the ones experiencing the most notable price action are Tron, which is up nearly 8 percent, Litecoin (LTC) and Binance Coin (BNB), which are both up about 3 percent.

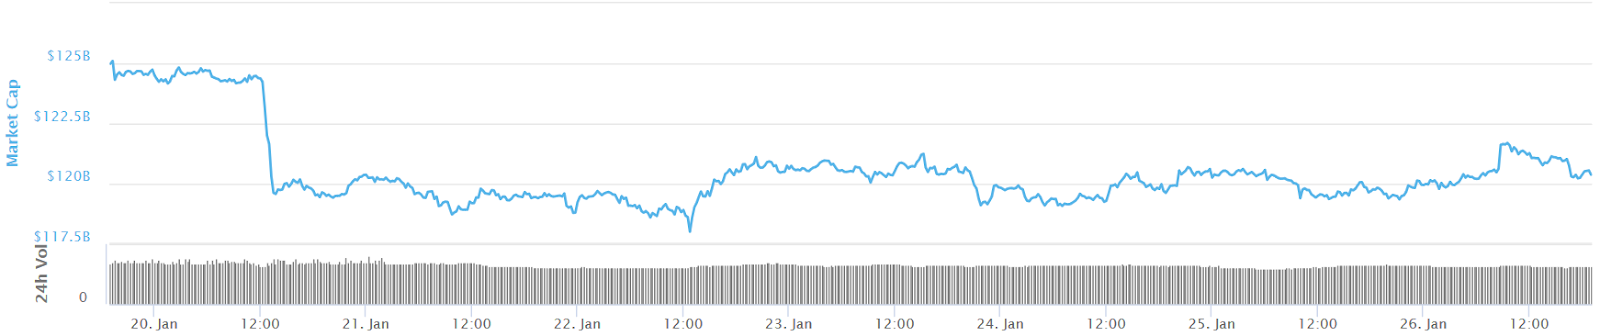
The combined market capitalization of all cryptocurrencies — currently equivalent to about $120.3 billion — is around 124.9 billion at press time, the value it reported one week ago.
Total crypto market cap 7-day chart

Total crypto market cap 7-day chart. Source: CoinMarketCap

As Cointelegraph recently reported, Nouriel Roubini, a notorious cryptocurrency critic, has stated that blockchain is “no better than an Excel spreadsheet” during a panel at the Blockchain Economic Forum in Davos.

Also, a survey by trade association the Global Blockchain Business Council recently showed that 40 percent of institutional investors believe blockchain may be the most important innovation since the internet.

Published at Sat, 26 Jan 2019 18:41:00 +0000

Previous Article

BTC FRACTAL IN FLAG

Next Article

Bitcoin big picture 2019!

You might be interested in …

Ether Price Analysis: Decrease in Buy Volume Pushes Price Lower

Ether Price Analysis

Over the past week, ETH-USD markets have seen a steady bleed as prices have slumped lower and lower. Any buy-back volume the markets managed to see was gradually eroded as the overall trend headed downward:

ETHUSD Macro Trend.png

Figure 1: ETH-USD, 4HR Candles, Gemini, Descending Trendline

As predicted in last week’s ETH-USD analysis, a failure to see any significant increase in buy volume led the market to see further tests of the Fibonacci Retracement values. At the time of this article, the market is rejecting the neckline of the previous Double Bottom Reversal (shown in yellow and noted at the 61% retracement values) and has moved on to retest the 50% retracement:

ETHUSD Fib Retracement.png

Figure 2: ETH-USD, 1HR Candles, GDAX, Fibonacci Retracement Values

Multiple tests of the 50% and 61% values are very common in both downward and upward trends and can sometimes provide great opportunities for short-term market trades due to the predictable support and resistance values. Today’s rejection of the 61% line is not entirely surprising; a lot of volume entered the market upon the arrival of the Double Bottom Reversal from last week, marking a potential turnaround from a strong bear market to a short-lived bull market. Ultimately, after failing to retrace the downtrend of the previous bear market, the bullish trend subsided and continued its way toward lower values.

In the coming days, don’t expect to see any strong upward movement from ETH-USD markets without a test of lower values. As we continue to test the Fibonacci Retracement values, we can expect to see some turbulence surrounding another test of the 50% and ultimately a test of the 61% values. If we manage to slide below the 61% line, there isn’t much in terms of support before the market reaches the lower $200s. A drop below the 61% line could lead to another slip of $50 as the market will ultimately try to find its next line of support.

Summary:

  1. The ETH-USD price has seen a slow descending trend as multiple tests of the established Fibonacci Retracement values have continued.

  2. If ETH-USD drops below the 61% Fibonacci Retracement values, a pullback to the $200s is most likely — this is a significant level of support below the $250s.

Trading and investing in digital assets like bitcoin and ether is highly speculative and comes with many risks. This analysis is for informational purposes and should not be considered investment advice. Statements and financial information on bitcoin Magazine and BTCMedia related sites do not necessarily reflect the opinion of BTCMedia and should not be construed as an endorsement or recommendation to buy, sell or hold. Past performance is not necessarily indicative of future results.

The post Ether Price Analysis: Decrease in Buy Volume Pushes Price Lower appeared first on Bitcoin Magazine.