Key Highlights
- ETH price tumbled and broke a major support at $648-660 against the US Dollar.
- This week’s highlighted important bullish trend line with support at $660 was breached on the hourly chart of ETH/USD (data feed via Kraken).
- The pair retested the broken support at $648, but it acted as a resistance and prevented gains.
Ethereum price is back in a bearish zone against the US Dollar and bitcoin. ETH/USD has to move back above $645-660 to start a fresh upside wave.
Ethereum Price Resistance
There was a move from well above $675 in ETH price against the US Dollar. The price declined and broke many supports such as $675 and $660. The decline gained pace once there was a break below the $675 support. It dropped by more than $80 and settled below the 100 hourly simple moving average. During the decline, there was a close below a crucial pivot level at $548.
More importantly, this week’s highlighted important bullish trend line with support at $660 was breached on the hourly chart of ETH/USD. There was even a downside spike below $600 and the price traded as low as $595.37. Later, an upside wave was initiated and the price moved above the 23.6% Fib retracement level of the last decline from the $711 high to $595 low. However, the upside move was protected by the previous support at $648. Moreover, the 50% Fib retracement level of the last decline from the $711 high to $595 low also acted as a .
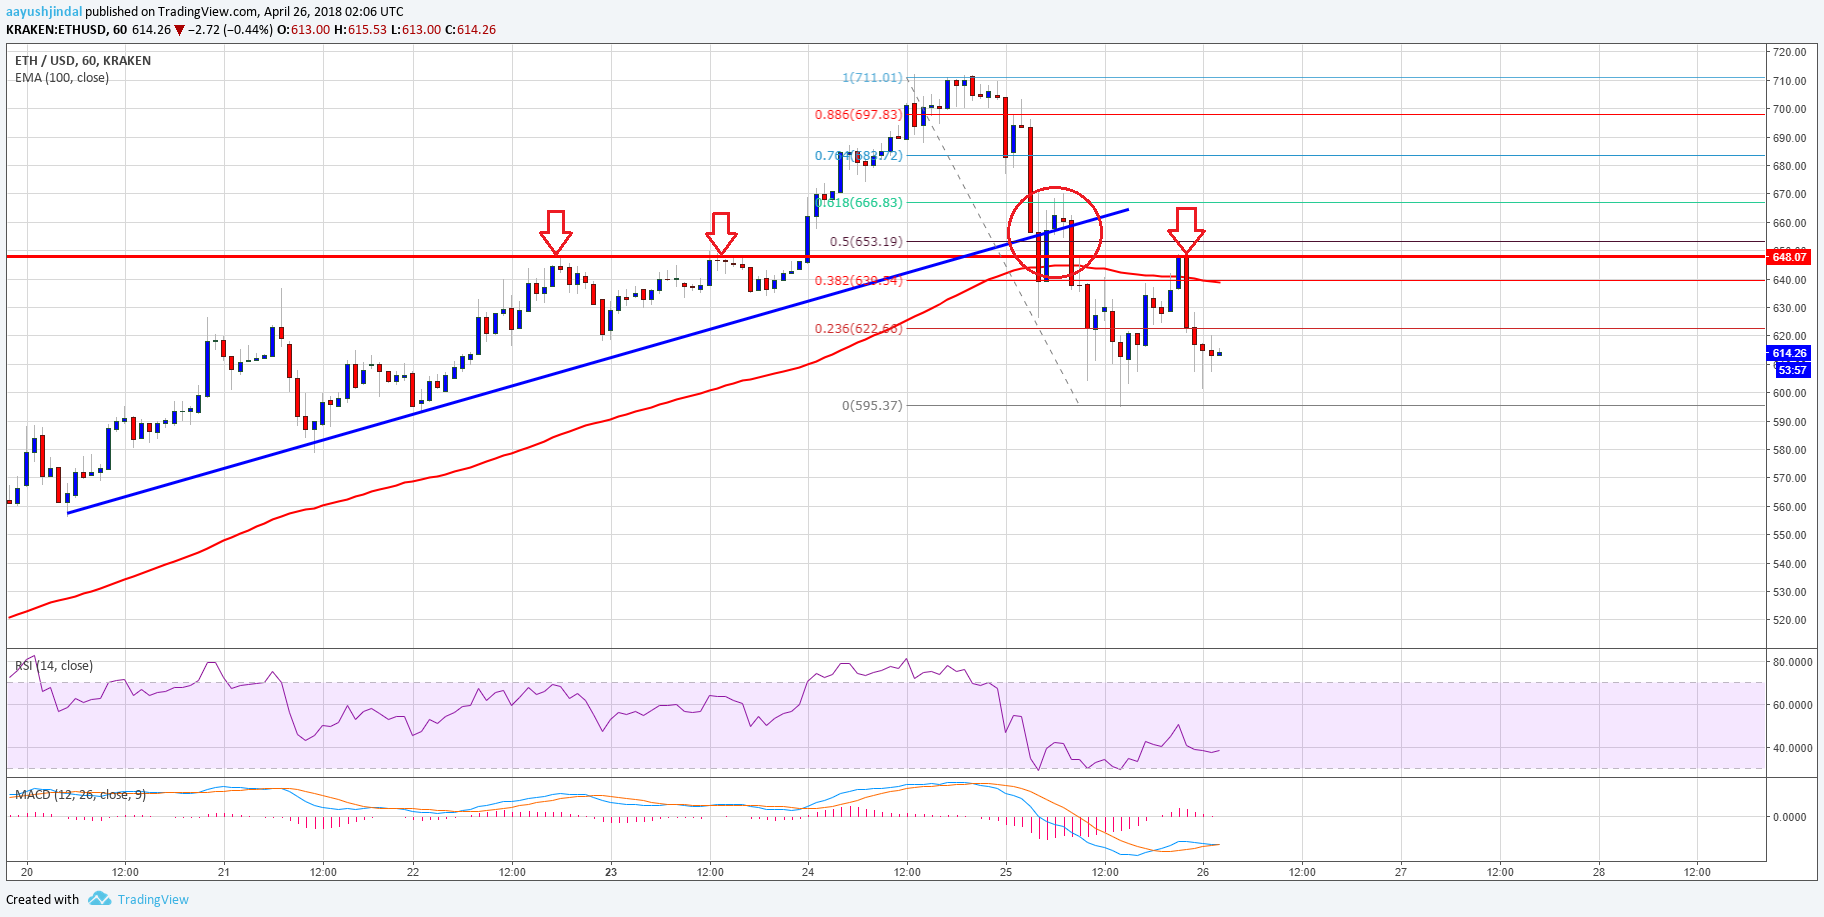
Looking at the , the price seems to be struggling to move back above $648. The stated $648 level was a support earlier and now it is acting as a hurdle. In the short term, there could be ranging moves below $648 before the price makes the next move.
Hourly MACD – The MACD has moved back in the bearish zone.
Hourly RSI – The RSI is now well below the 50 level.
Major Support Level – $595
Major Resistance Level – $642
Published at Thu, 26 Apr 2018 04:28:34 +0000
Analysis
