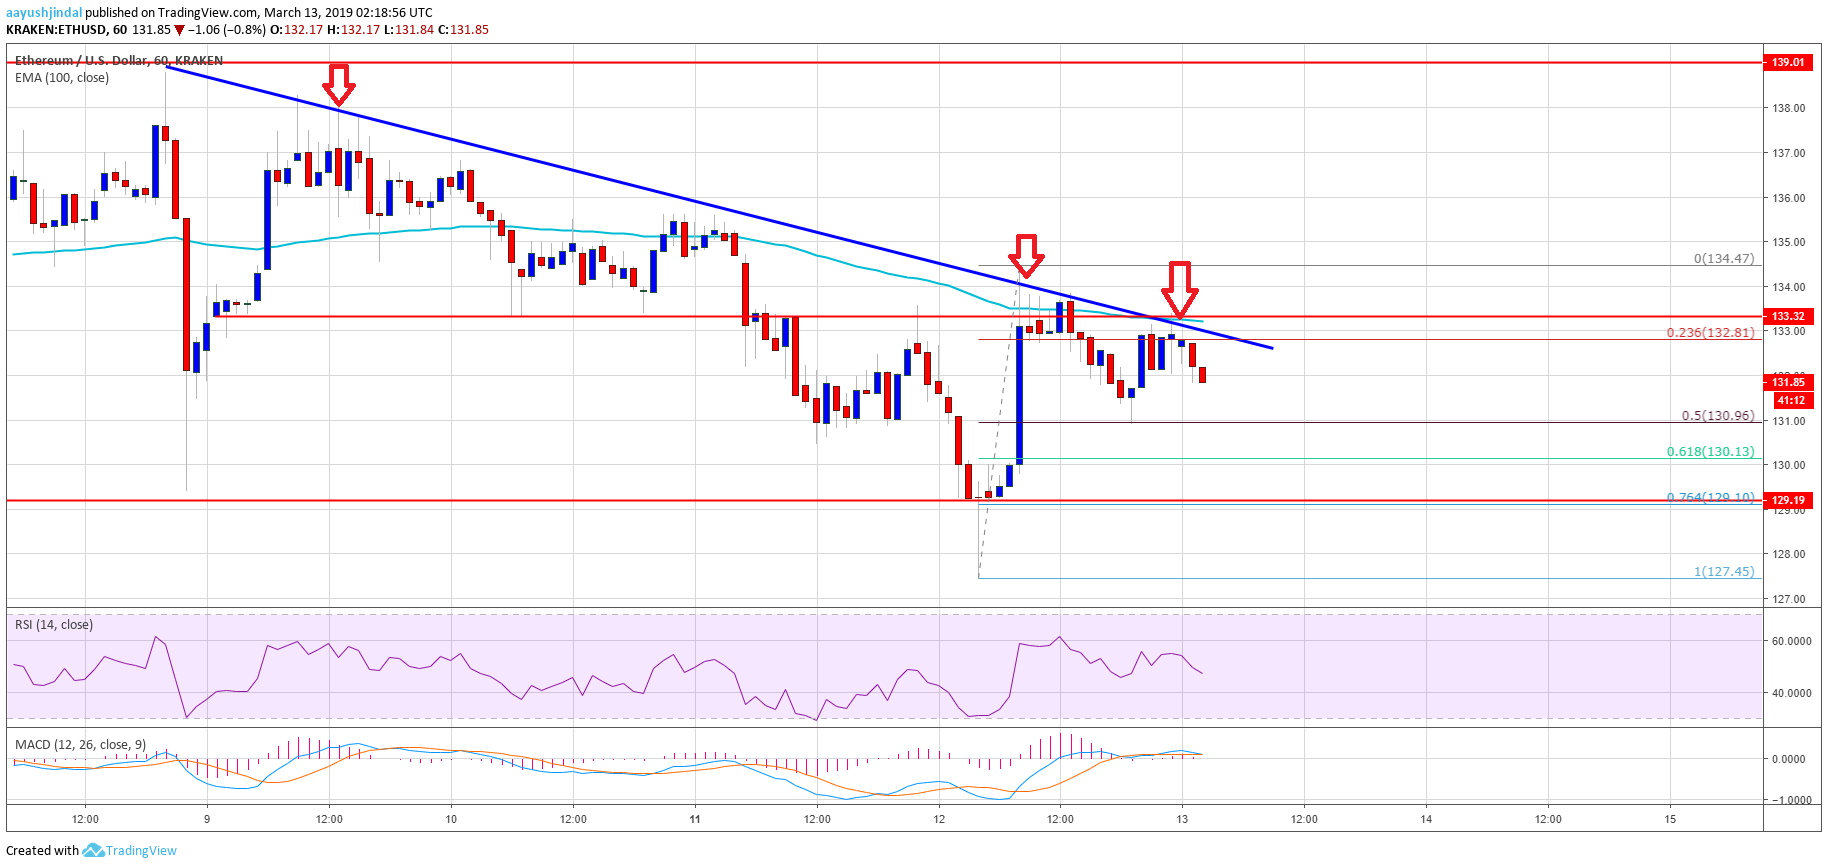
- ETH price remained below the key $133 and $134 resistance levels against the US Dollar.
- SEC’s Chairman reaffirmed that Ethereum (ETH) is not a security, but it failed to boost the market.
- This week’s important bearish trend line is in place with resistance at $133 on the hourly chart of ETH/USD (data feed via Kraken).
- The pair needs to surpass the trend line and the $134 resistance for a solid upward move.
price remained below major resistance levels against the US Dollar and . ETH failed to gain traction despite that it is not a security.
Ethereum Price Analysis
Recently, ETH price recovered nicely after towards the $127 level against the US Dollar. The ETH/USD pair formed a low just above the $127 level and later corrected above the $129 resistance level. It even jumped above the $130 level and the 50% Fib retracement level of the last slide from the $135 high to $127 swing low. However, the upside move was capped by the $134 resistance level and the 100 hourly simple moving average. There were a couple of spikes near the $134 resistance before the price corrected lower.
It declined below the 23.6% Fib retracement level of the recent wave from the $127 swing low to $134 high. The price declined below the $132 level, but the $131 level acted as a decent support. Besides, the 50% Fib retracement level of the recent wave from the $127 swing low to $134 high provided support. There was a fresh upside move, but the price is still facing a strong resistance near $134 and the 100 hourly SMA. More importantly, is in place with resistance at $133 on the hourly chart of ETH/USD.
Therefore, a proper break above the trend line, the 100 hourly SMA, and the $134 resistance is must for more gains. The next key resistance is at $136, above which the price may test $139. On the other hand, if the price fails to climb above $134, it could decline again below the $131 support.
Looking at the , ETH price is clearly facing a strong resistance near the $133-134 area. As long as sellers keep the price below the $134 level, there is a risk of more losses in the near term. If not, thee price could rally above the $136 level and revisit the $139-140 resistance area.
ETH Technical Indicators
Hourly MACD – The MACD for ETH/USD is currently flat in the bearish zone.
Hourly RSI – The RSI for ETH/USD recently moved lower from the 55 level and it is currently near 50.
Major Support Level – $130
Major Resistance Level – $134
Published at Wed, 13 Mar 2019 04:16:30 +0000