August 16, 2026

Capitalizations Index – B ∞/21M

Circle Reveals $24 Billion Cryptocurrency OTC Trading Volume in 2018

Circle reveals $24 billion cryptocurrency otc trading volume in 2018

Circle Reveals $24 Billion Cryptocurrency OTC Trading Volume in 2018

Goldman Sachs-funded cryptocurrency startup, Circle, recently released its list of accomplishments for the year 2018. The company says it executed over-the-counter (OTC) crypto trades to the tune of $24 billion in notional volume.


Circle Does $24 Billion in Cryptocurrency OTC Trading

Circle announced its 2018 achievements in a blog post published by the company on Thursday (January 3, 2019). Circle Trade, the OTC desk of the company, executed over 10,000 OTC trades worth $24 billion, it reveals.

Commenting further on the growth of the Circle Trade platform, the announcement notes:

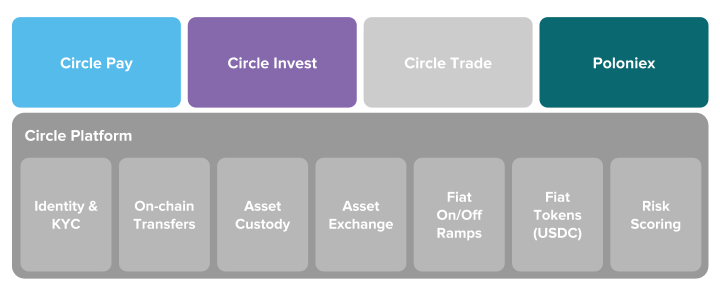
Circle Trade has become a core liquidity provider to the entire crypto ecosystem — including miners, exchanges, project developers, and founders — and to the new crypto asset investor base of VCs, crypto funds, hedge funds, and family offices all around the world.

The figures published by Circle are indicative of the recent trend observed in the OTC arena. In December 2018, Bitcoinist reported a boom in BTC OTC trading according to research by Diar. Other major players like Coinbase also show an increase in trading volumes during OTC hours.

The $24 billion notional trading might even indicate that Circle executed more OTC trades than Coinbase and Greyscale (GBTC) combined. Data from Diar showed Coinbases’s OTC volume at about $12 billion with $11 billion for GBTC.

A Couple of Acquisitions

The acquisition of Poloniex by Circle was arguably one of the significant developments that occurred in 2018. Back in February 2018, the company announced its acquisition of Poloniex, one of the largest cryptocurrency exchange platforms at the time.

According to Circle, it has made great efforts in improving the platform’s compliance standards. In May 2018, Bitcoinist reported on the uproar caused by new KYC requirements introduced at the time. Many legacy account holders felt the move broke several assurances provided by the company in late 2017.

For Circle, the steps taken have yielded fruit especially in the area of customer support. The blog post revealed a 99.5 percent decrease in the number of open tickets since the acquisition.

In 2018, the Goldman Sachs-backed Circle also acquired SeedInvest as part of its drive to become a regulated broker-dealer. With tightening regulations in the US crypto landscape, startups like Circle and Coinbase have been pursuing regulatory approval to expand their cryptocurrency product catalogs.
Circle reveals $24 billion cryptocurrency otc trading volume in 2018

Stable Coin Launch and Company Growth

Circle also ventured into the stablecoin arena with the launch of USD Coin (USDC). This development led to the creation of the CENTRE consortium, a joint venture with San Francisco-based exchange giant, Coinbase.

According to the announcement, USDC is now the second-largest fiat collateralized stablecoin after Tether with a market capitalization more than $280 million. Multiple cryptocurrency exchange platforms also support the stablecoin.

2019 will be Circle’s sixth year in existence, and the company says that it wants to focus on capacity building for the industry regardless of market conditions. Circle says:

We see the future of the global economy as open, shared, inclusive, distributed, and powerful — not only for a few chosen gatekeepers but for all who connect.

What do you think about Circle’s 2018 figures despite a drop in overall prices? Let us know your thoughts in the comments below!


Image courtesy of Twitter (@zhusu) and Circle, Shutterstock

Published at Sat, 05 Jan 2019 10:00:01 +0000

Previous Article

Fred Wilson: Crypto Bottom Close But Not a ‘Safe Haven’ for Stock Market Downturn

Next Article

BTCUSD medium-term EW possibility: Bitcoin [BTC] ABC correction on 4h

You might be interested in …

Icoin

iCoin

iCoin Register now www.icoin.in.th iCoin is a brand new blockchain based startup that seeks to redefine the very idea of trade in the cryptocurrency field. It is an exchange that was conceived by a visionary […]

Bitcoin Price Analysis: Choppy Market Conditions Lead to Tests of Parabolic Resistance

Bitcoin Price Analysis

The bitcoin market has been getting chopped to pieces for weeks as the market has faked up, faked down, consolidated and routinely stopped out traders. Last week, we discussed a potential large move due to a consolidated symmetrical triangle. However, the breakout failed to garner any momentum and ultimately flopped as the move upward quickly died down and ultimately reversed.

At the time of this article, however, the market is poised in a precarious situation as it tiptoes around historic support/resistance along the parabolic envelope:

Figure_1 (3).JPGFigure 1: BTC-USD, 2-Hour Candles, Parabolic Curve Test

As noted in previous bitcoin analyses, this parabolic envelope has been the dominating trend for the last three years:

Figure_2 (3).JPGFigure 2: BTC-USD, 1-Day Candles, Macro Trend

Over Thanksgiving, the parabolic trend that was previously governing much of the three-year bull market broke upward as the market’s parabolic movement accelerated aggressively upward. Since the break to the top of the parabolic envelope, the market has been on shaky ground where, at one point, it even did a massive 50% retracement. Since that aggressive retracement, the market has yet to fully recover and resume any semblance of a bullish continuation. Currently, the once-supportive parabolic curve is now proving to be a point of resistance as the market has made several tests of the upper resistance.  

To date, this marks the fifth test of the parabolic trend. This time, however, we are testing it from the bottom of the parabola. Previous tests from the top side of the parabola were swiftly rejected causing very little market activity to take place below the parabolic trend. It seems, yet again, bitcoin is at a crossroads as it decides if the upper parabolic resistance is too strong to resume an uptrend.

If the market continues downward, we can expect to find support along the low boundaries of the trading range (shown in blue), the linear trend (shown in pink) and the lower parabolic curve (shown in black):

Figure_3 (2).JPGFigure 3: BTC-USD, 2-Hour Candles, Next Lines of Support

Summary:

  1. Choppy market conditions have led bitcoin to test the parabolic support — a previous guiding trend for the last three years.

  2. A failure to break the upper parabolic resistance may cause a test of lower values.

  3. Support will be found at the lower ranges of the trading range and along the linear and parabolic trend lines.

Trading and investing in digital assets like bitcoin and ether is highly speculative and comes with many risks. This analysis is for informational purposes and should not be considered investment advice. Statements and financial information on bitcoin Magazine and BTC Media related sites do not necessarily reflect the opinion of BTC Media and should not be construed as an endorsement or recommendation to buy, sell or hold. Past performance is not necessarily indicative of future results.


The post Bitcoin Price Analysis: Choppy Market Conditions Lead to Tests of Parabolic Resistance appeared first on Bitcoin Magazine.

The only bitcoin chart you should be looking at

The Only Bitcoin Chart You Should Be Looking At

The Only bitcoin Chart You Should Be Looking At EN English (UK) EN English (IN) DE Deutsch FR Français ES Español IT Italiano PL Polski SV Svenska TR Türkçe RU Русский PT Português ID Bahasa […]