Key Points
- bitcoin price recovered nicely from $7300, but it is struggling to gain traction against the US Dollar.
- There is a major bearish trend line forming with resistance at $8,750 on the 4-hours chart of the BTC/USD pair (data feed from Kraken).
- The pair must hold the $8,400-8450 support area to avoid any further declines toward $8,000.
bitcoin price is struggling to break a key barrier at $8,800 against the US Dollar. BTC/USD is slightly bearish with an important support around the $8,400-8,450 zone.
bitcoin Price Bearish Resistance
This past week, there was a in bitcoin price below the $8,000 level against the US Dollar. The price declined below the $7,500 support and traded as low as $7,296. Later, it staged an upside recovery and moved above the $7,500 level. It broke the 23.6% Fib retracement level of the last drop from the $9,912 high to $7,296 low.
Buyers gained traction and pushed the price above $8,000. Moreover, there was a break above the 50% Fib retracement level of the last drop from the $9,912 high to $7,296 low. However, the upside move was protected by the $9,000 resistance zone and the 100 simple moving average (4-hours). More importantly, a major with resistance at $8,750 on the 4-hours chart of the BTC/USD pair is acting as a key hurdle. At the moment, the price is moving lower and is currently trading below $8,750 and the 100 SMA.
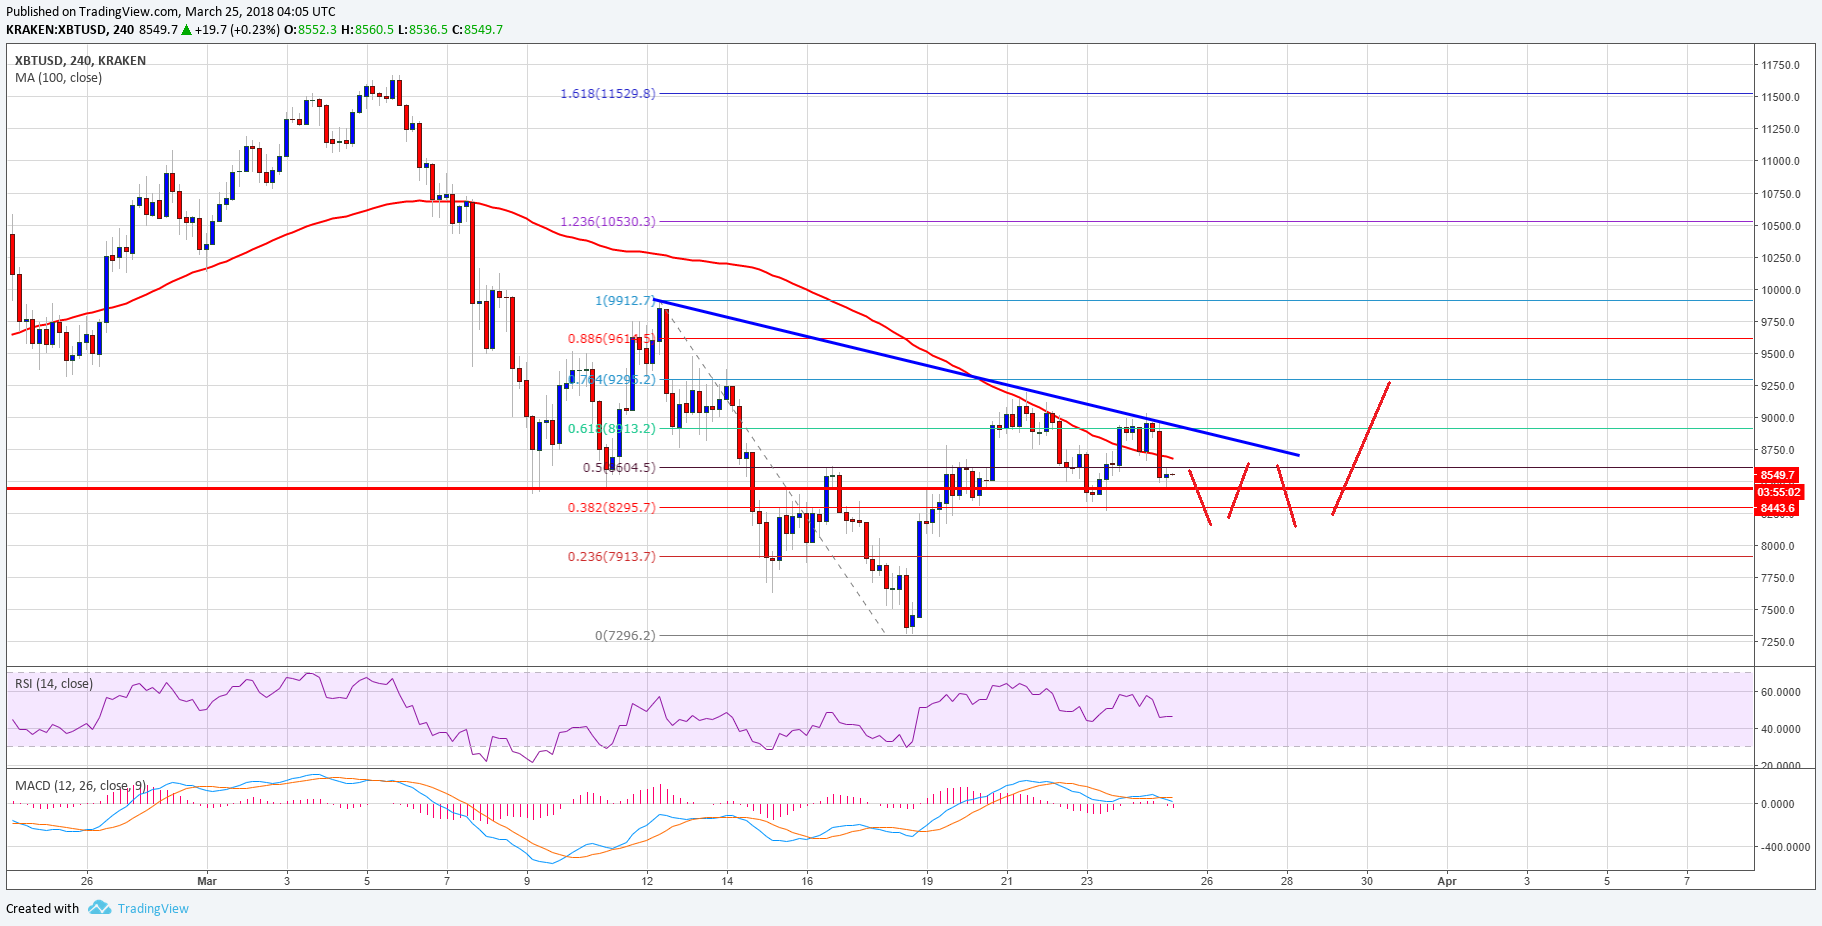
On the downside, there is a crucial support at $8,400-8,450. BTC must hold the mentioned $8,400 support to avoid a push into the bearish zone. Below $8,400, the price could even break the $8,000 support. On the upside, a successful break and close above $8,800 is needed for buyers to gain control.
Looking at the technical indicators:
4-hours MACD – The MACD for BTC/USD is about to move back in the bearish zone.
4-hours RSI (Relative Strength Index) – The RSI is currently well below the 50 level.
Major Support Level – $8,400
Major Resistance Level – $8,800
Charts courtesy –
Published at Sun, 25 Mar 2018 06:30:57 +0000
Analysis