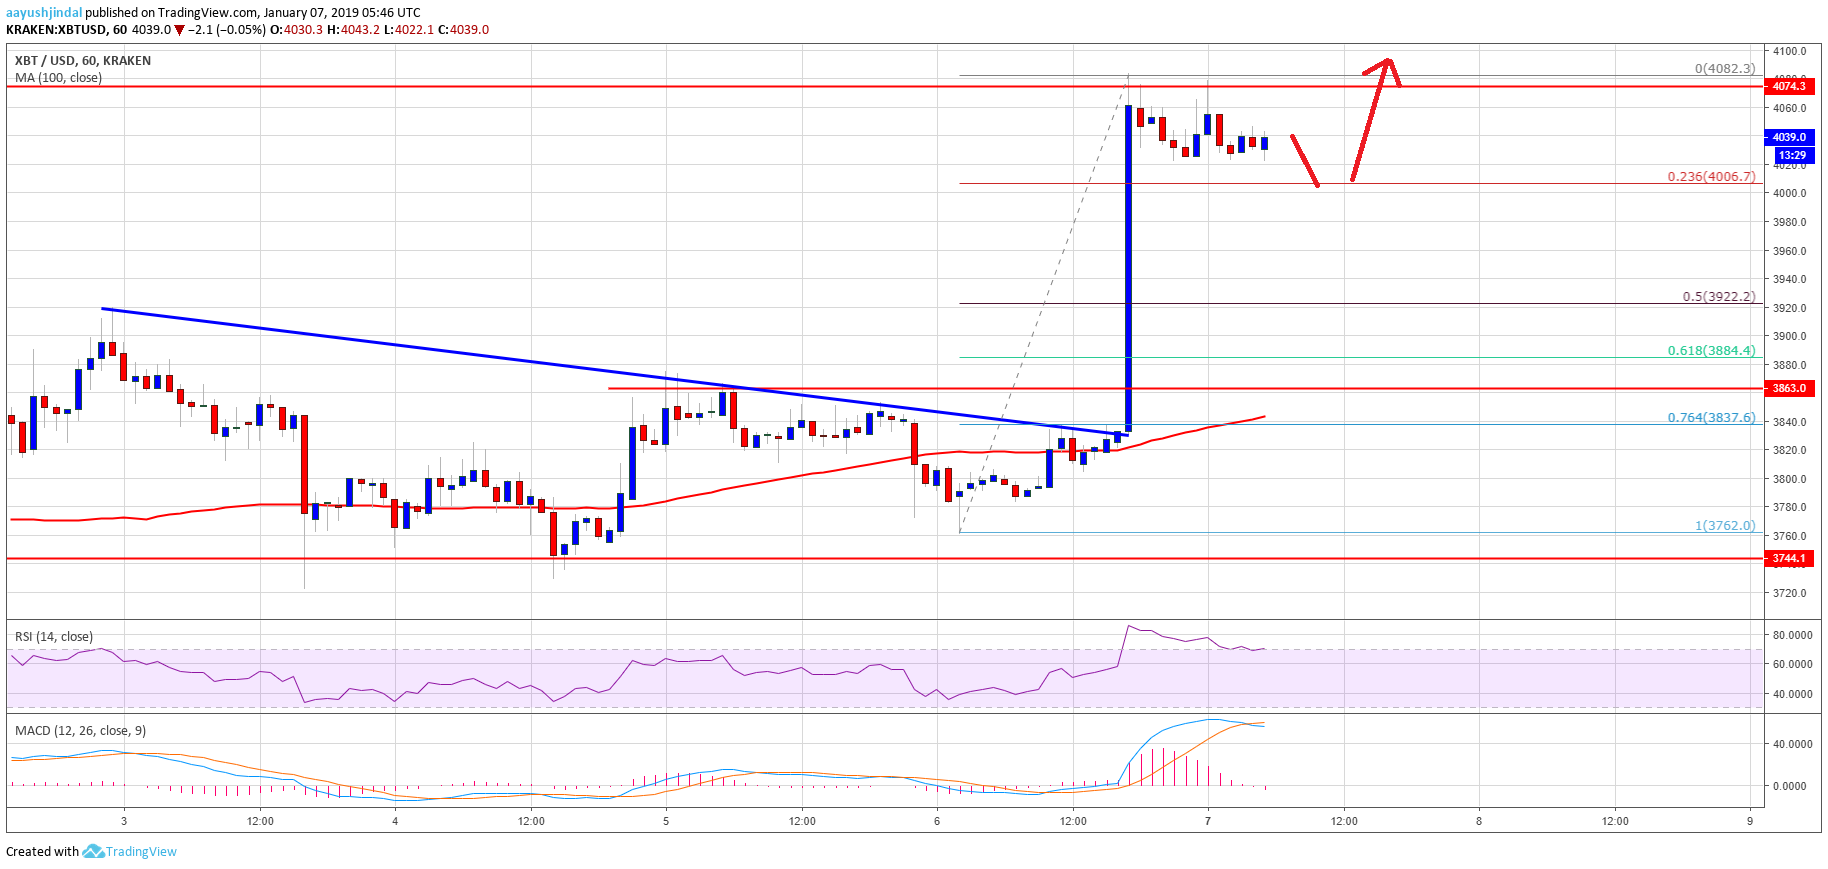
- bitcoin price finally broke the $4,000 barrier and traded towards $4,100 against the US Dollar.
- There was a break above a major bearish trend line with resistance at $3,830 on the hourly chart of the BTC/USD pair (data feed from Kraken).
- The price is currently consolidating gains and dips towards $4,000 and $3,920 remain supported.
bitcoin price gained bullish momentum and cleared $4,000 against the US Dollar. BTC could correct a few points, but it is likely to resume uptrend above $4,100.
bitcoin Price Analysis
Recently, we discussed about a above $4,000 in bitcoin [BTC] price against the US Dollar. The BTC/USD pair did move higher and broke the $3,950 and $4,000 resistance levels. The recent upward move was strong as the price even cleared the $4,050 level and 100 hourly simple moving average. More importantly, there was a solid hourly candle formed, piercing the $4,000 barrier.
During the rise, there was a break above a major bearish trend line with resistance at $3,830 on the hourly chart of the BTC/USD pair. The pair traded as high as $4,082 and later started consolidating gains. An initial support is the 23.6% Fib retracement level of the last wave from the $3,762 low to $4,082 high. Below $4,000, the price may move towards the $3,920 support level. It represents the 50% Fib retracement level of the last wave from the $3,762 low to $4,082 high. The for buyers is near the $3,860 level, which was a strong resistance this past week. Therefore, if there is a downside correction, the price may find bids near the $4,000 and $3,920 levels.
Looking at the , bitcoin [BTC] price clearly broke a crucial resistance near $4,000 and $4,050. It is currently placed nicely above the 100 hourly SMA, but it must clear the $4,080-4,100 barrier for more gains. The next key resistance is at $4,200 followed by $4,220.
Technical indicators
Hourly MACD – The MACD for BTC/USD is slowly moving in the bearish zone, suggesting a downside correction.
Hourly RSI (Relative Strength Index) – The RSI for BTC/USD is well below the 60 level, with a positive bias.
Major Support Level – $3,920
Major Resistance Level – $4,100
Published at Mon, 07 Jan 2019 07:00:24 +0000