October 9, 2026

Capitalizations Index – B ∞/21M

Bitcoin Price Analysis: BTC/USD Ready to Break Out or April Fools?

Bitcoin price analysis: btc/usd ready to break out or april fools?

Bitcoin Price Analysis: BTC/USD Ready to Break Out or April Fools?

bitcoin price completed the close of the Daily, Weekly, Monthly and Q1 in the green. Let’s take a look at the charts to determine what could be expected for the number one crypto asset in the near future.


bitcoin Price: Daily Chart

The Daily Chart for bitcoin price paints an overall positive picture for the bulls. The previous week’s bear blockade at $4050, which was the task at hand for the bulls, was ultimately overcome last Friday.

Bulls weren’t the fools on this April 1st as BTC hit a new yearly high at $4138.

The $4050 level itself has already been tested on Saturday and also in the early hours prior to the run up to the high – these are encouraging signs of prior resistance now becoming support.

Bitcoin price analysis: btc/usd ready to break out or april fools?

The volume profile shown down the right hand side of the chart illustrates that the Point of Control in terms of price where volume is traded remains back at $3906. This is also where the 50-day moving average is found.

This is where the bulls need to step in should the bears decide to take advantage of the decreasing volume, and successfully break price down.

Overall volume is still declining as price is rising, however. This is generally seen to be bearish divergence so the bulls should proceed with relative caution approaching resistance at $4250.

Meanwhile, the bulls continue to consolidate in a bottoming Adam and Eve with an inverse head and shoulders pattern within Eve’s Cup.

Should this play out, the bulls will look to break toward the measured move targets for both, being $4800- $5000. BTC price needs to see a high volume break out to trigger this move given that the market is grinding up tentatively on low volume in a bear market.

Should this pattern fail to break out, it could prove to be crushing for market sentiment and the bulls if they fail to find support at the key daily Moving Average levels. A move to the mid $2000s may then be in play.

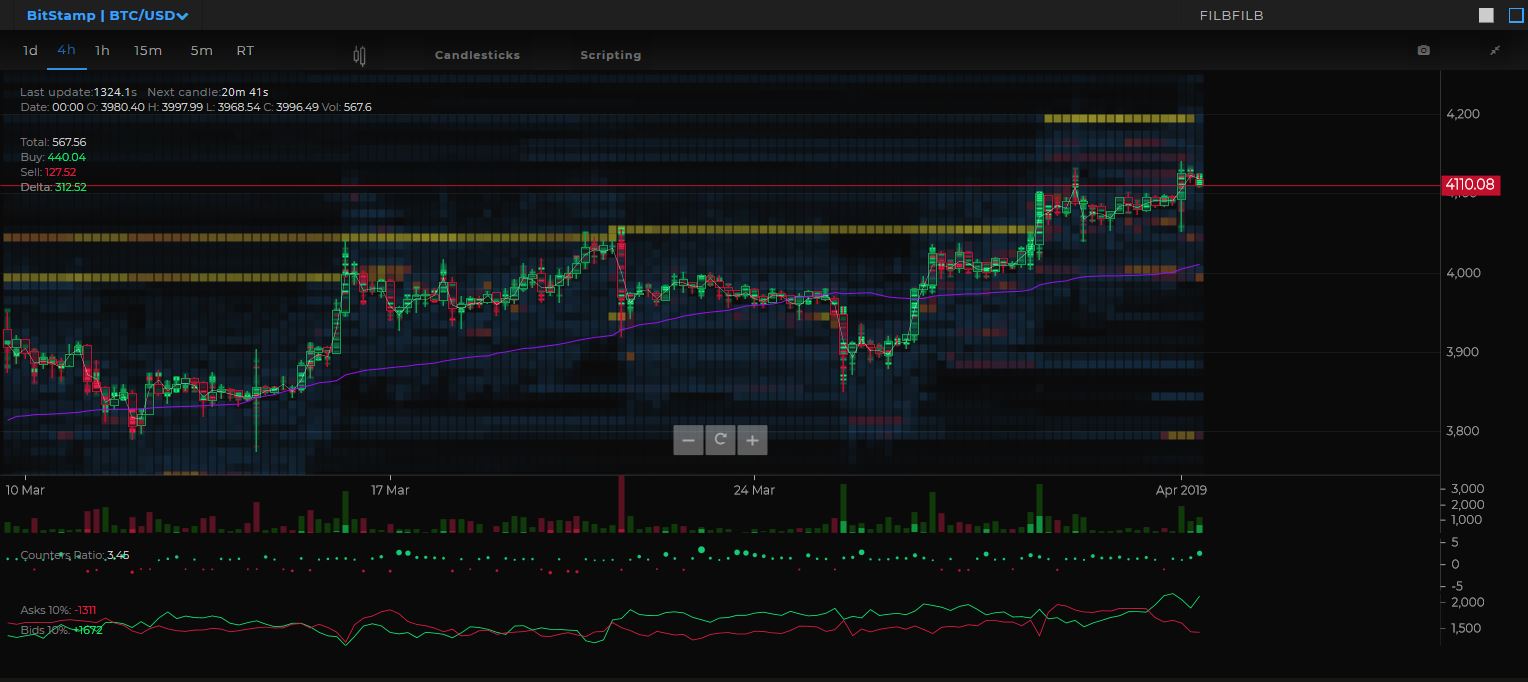
Order Book Analysis

Looking at the order book, we can see that there has been selling interest art $4250 in the same way that there was at $4050, which served to cap price.

On the 4-hour timeframe, this appears to have been pulled for now, which may be a positive sign for the bulls. But it does serve as a reminder that there is selling interest above at resistance, which could not be broken back in December.
Bitcoin price analysis: btc/usd ready to break out or april fools?

bitcoin Price: Weekly & Monthly Charts

The monthly chart illustrates that bitcoin price has now moved from 2019 lows of $3320, closing up at $4096 – some 12% for the year, which is difficult to ignore.

It also shows that BTC closed march above the December 2019 lows and has printed a second higher low on the MACD, just as the MACD is approaching zero – another positive sign.

Bitcoin price analysis: btc/usd ready to break out or april fools?

The Weekly Chart shows that bitcoin price successfully closed the week above the 20-week moving average, again being positive. It is also the closest it’s been to the Bollinger bands, which are now the tightest they’ve been throughout the bear market on the weekly chart, suggesting that a big move is imminent.

The MACD is also into the ninth week of higher highs and is crossed bullish, but still below zero. Again, this is a positive sign.

Positive Signs for a Bottom

In summary, the bitcoin and wider crypto markets are showing all the positive signs one would expect to see of a market that is trying to find a bottom and is doing so consistently.

The main concern is the lack of meaningful volume and a higher high above $4250 to confirm that there is a break in the bearish trend overall. Fortunately, we are at a pivotal point and are about to find out in due course.

Trade bitcoin (BTC), Litecoin (LTC) and other cryptocurrencies on online bitcoin forex broker platform evolve.markets. 

To get receive updates for the writer you can follow on Twitter (@filbfilb) and TradingView.

The views and opinions of the writer should not be misconstrued as financial advice.  For disclosure, the writer holds bitcoin at the time of writing.


Images courtesy of Shutterstock, Tradingview.com, Tensor Charts

The Rundown

Published at Mon, 01 Apr 2019 13:00:35 +0000

Previous Article

Play the chances, don´t follow the herd

Next Article

How Bitcoin May Surge off of Billions of Dollars From IPOs Like Lyft, Uber

You might be interested in …

Bitcoin Price Analysis: There May Still Be Some Life in These Exhausted Bulls

Bitcoin Price Analysis

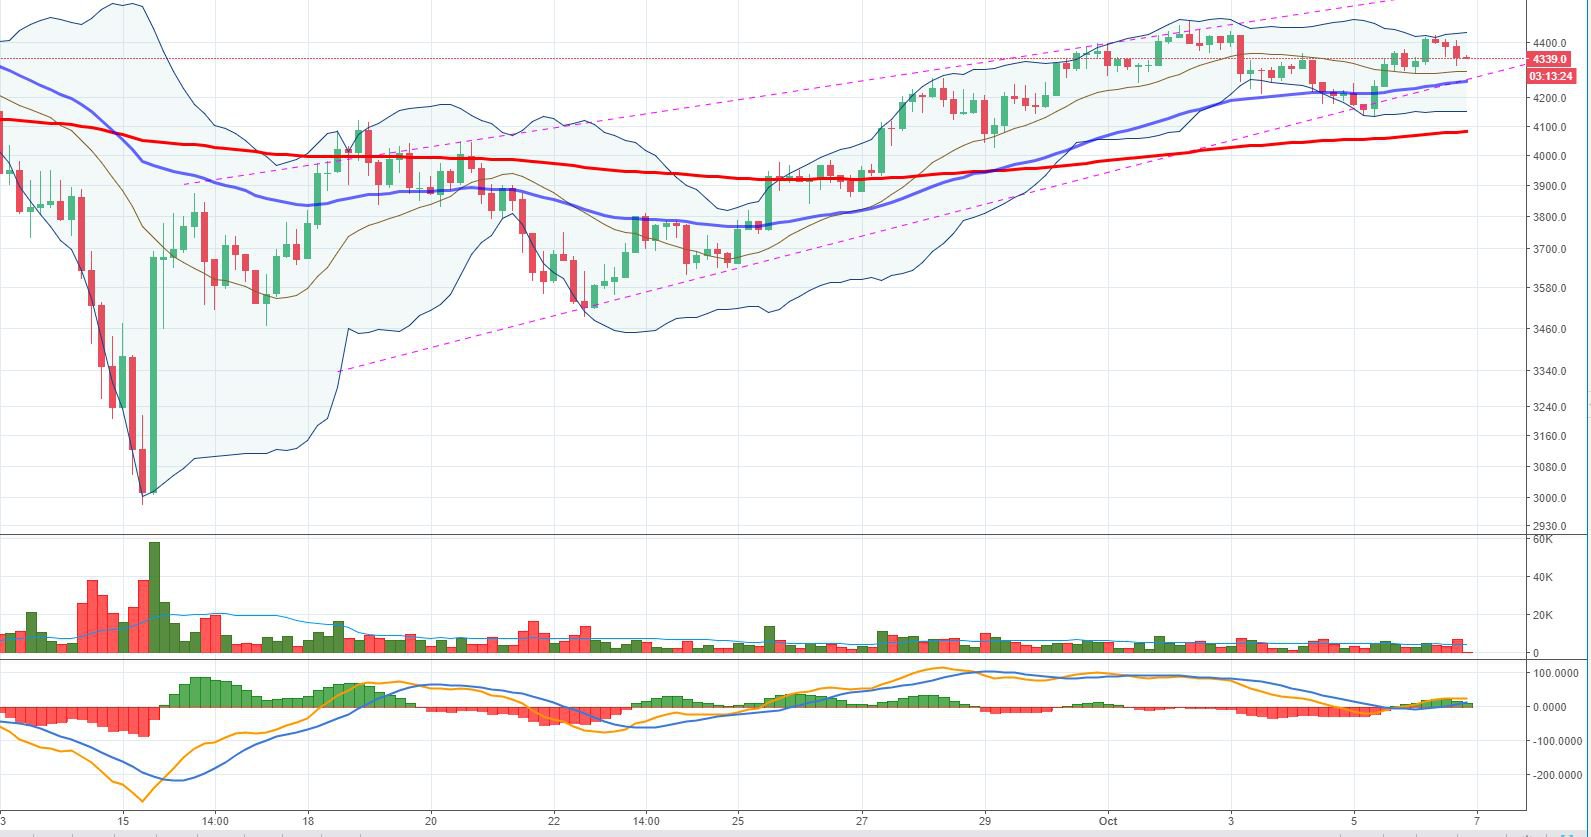
Over the last week, the BTC-USD market has seen some major price swings. At one point, the price nearly reached $4500 only to see it pull back down to the low $4100s. And now, within two days, the price has topped back out in the low $4400s. There has been some major chop and seemingly erratic dumps and price hikes, but overall there seems to be a common upward trent within the macro market movements:

Figure_1 (10).JPGFigure 1: BTC-USD, 4-Hour Candles, Bitfinex, Macro Trend

Since the bottom of the bear run last month, bitcoin has seen several rallies that have continued along a generally positive trend. The figure above shows a trend of higher highs, higher lows and an upper/lower boundary that is converging. This type of price activity is called a rising wedge.

Coupled with this price growth is a trend of decreasing volume throughout the length of the wedge. A rising wedge is generally a bearish trend that shows weakening bullish pressure as each subsequent rally becomes smaller and smaller. As the price corrects, there are rallies that bring the price to new highs, but ultimately rally on smaller and smaller volume.

As of the time of this article, the latest rally has failed to make a new high in the low $4400s. A breakdown of this wedge could lead to a substantial price drop of approximately $500 below the point of breakdown. The approximate price target would be around $3700.

Although rising wedges are bearish in nature, that doesn’t mean new highs aren’t in store for bitcoin. The macro trend is currently showing a potential bearish move, but there is still some strength in the market. The market is currently trending above the 50 EMA and 200 EMA which, by many standards, is representative of a trending bullish market. Although the price is trending upward and the overall EMA signals are showing potential upward continuation, there are pretty clear signs of bullish exhaustion on the macro scale:

Figure_2 (10).JPGFigure 2: BTC-USD, 4-Hour Candles, Bitfinex, Bullish Exhaustion

As stated earlier, the rising wedge is paired with decreasing volume which is a clear giveaway that upward momentum is waning. To complement this exhaustion, the RSI and MACD are showing clear signs of bearish divergence in the current market and are demonstrating a lack of the bullish momentum necessary to sustain a bull market.

If the rising wedge breaks to the bottom, we can expect the support levels to lie on the Fibonacci Retracement values shown above. The ultimate price target of the rising wedge would have BTC-USD testing the 50% retracement values.

On a very, very macro scale, there are clear signs of overall bullish exhaustion since the beginning of its run from the low $1000s:

Figure_3 (10).JPGFigure 3: BTC-USD, 1-Week Candles, Bitfinex, Macro Bullish Exhaustion

Two very clear indicators of bullish momentum loss lie on the RSI and the MACD. The price of bitcoin has pushed to strong, new highs but it has left the momentum indicators weakening. The RSI is showing strong macro divergence, and the MACD is on the verge of flipping bearish for the first time since the ETF was denied back in April.

It’s not hard to argue that bitcoin has seen heavy price growth and needs a little room to breath. It is entirely possible the market won’t see any strong pullback and it may go sideways. However, in the event that a sustained market pulls the price down, we can expect to find support along the midline of the Bollinger Bands in the low $3000s. It’s important that the above chart and market implications of this macro divergence are occurring on candles that are one week. So, while this doesn’t mean the market will just suddenly plummet, it is important to understand that a substantial price drop could be in bitcoin’s future.

Even though I gave plenty of bearish arguments, it should be noted that these predictions are on a macro scale, and the immediate trend is showing strong support along the 50 and 200 EMAs. The market is bullish until proven otherwise. As the saying goes: “the trend is your friend.” bitcoin has had one heck of a year so far, but I think it’s important to point out the clear signs of a macro bullish exhaustion:

Summary:

  1. bitcoin is finding support and showing a bullish trend along the 50 and 200 EMAs.

  2. On a macro level, the trend is pushing upward but is showing a potential bearish move if the market breaks out of the rising wedge identified in Figure 1.

  3. A breakout of this wedge would have its price target in the $3700s.

Trading and investing in digital assets like bitcoin, bitcoin cash and ether is highly speculative and comes with many risks. This analysis is for informational purposes and should not be considered investment advice. Statements and financial information on bitcoin Magazine and BTC Media related sites do not necessarily reflect the opinion of BTC Media and should not be construed as an endorsement or recommendation to buy, sell or hold. Past performance is not necessarily indicative of future results.

The post Bitcoin Price Analysis: There May Still Be Some Life in These Exhausted Bulls appeared first on Bitcoin Magazine.