Key Points
- bitcoin cash price was not able to move above $1,480-1,500 and declined sharply against the US Dollar.
- There was a break below a key connecting bullish trend line with support at $1,410 on the hourly chart of the BCH/USD pair (data feed from Kraken).
- The pair even broke the last swing low and it could continue to decline towards the $1,200 level.
bitcoin cash price tumbled below key supports against the US Dollar. BCH/USD is now trading well below $1,300 with a bearish angle in the short term.
bitcoin Cash Price Decline
Yesterday, we discussed how $1,480 and $1,500 levels in bitcoin cash price against the US Dollar. The price failed to move above the mentioned levels and declined sharply below $1,400. The decline was such that the price even broke the 76.4% Fib retracement level of the last wave from the $1,330 low to $1,495 high.
It opened the doors for more losses and there was a break below a key connecting bullish trend line with support at $1,410 on the hourly chart of the BCH/USD pair. The pair even settled below the $1,300 support and the 100 hourly simple moving average. These are below $1,300 and it seems like the price may continue to trade lower in the short term. It is currently trading near the $1,240 level with a lot of selling pressure. If it corrects higher it could test the 23.6% Fib retracement level of the last drop from the $1,495 high to $1,240 low.
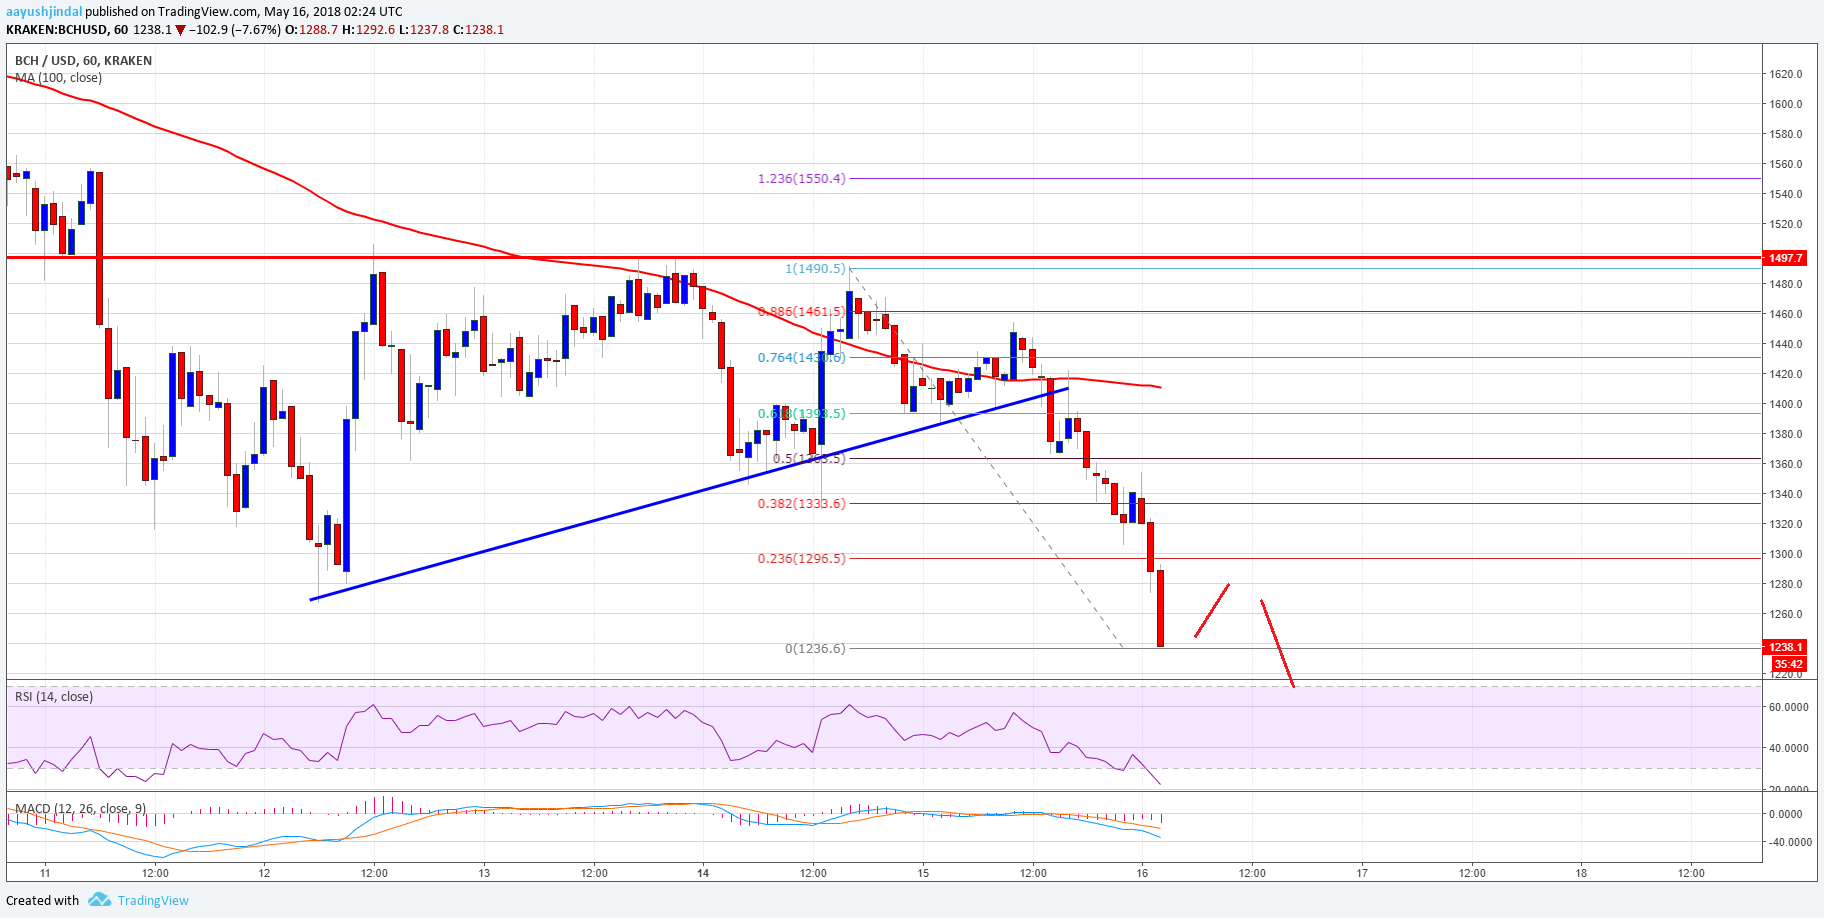
Looking at the , the price may continue to accelerate declines towards the $1,200 level. Any further declines would depend how buyers react around the stated $1,200 support level in the near term.
Looking at the technical indicators:
Hourly MACD – The MACD for BCH/USD is accelerating momentum in the bearish zone.
Hourly RSI (Relative Strength Index) – The RSI for BCH/USD has reached the oversold levels.
Major Support Level – $1,200
Major Resistance Level – $1,300
Published at Wed, 16 May 2018 04:08:32 +0000
Analysis

