May 25, 2026

Capitalizations Index – B ∞/21M

Asian Cryptocurrency Trading Update: Nano Lifted on Binance Giveaway

Asian cryptocurrency trading update: nano lifted on binance giveaway

Asian Cryptocurrency Trading Update: Nano Lifted on Binance Giveaway

As we end the week crypto markets are still looking bullish and most coins are on the way up. Total market capitalization is now over $450 billion and bitcoin has made more gains overnight. Currently trading at $9,600 BTC is up 3.8% on the day and is approaching key resistance near the $10k level. Altcoins are a mixed bunch during Asian trading, some are performing well while others have retracted a little from weekly highs. The coin out in front at the moment is Nano.

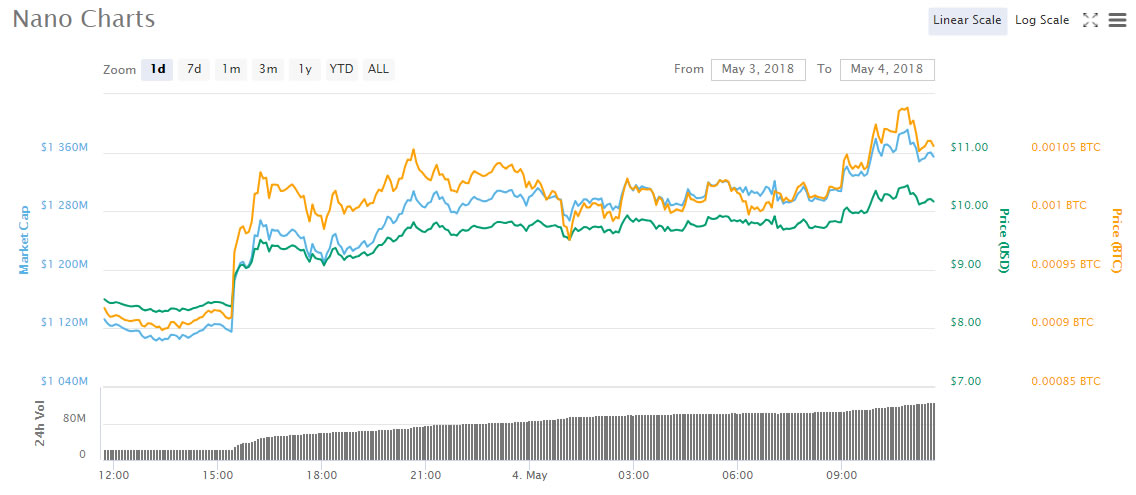
According to Coinmarketcap Nano is trading 21% higher on the day. It is the only altcoin in the top 25 with double digit gains at the moment. Currently trading at $10.2 Nano has made gains from $8.45 where it was this time yesterday. Over the week this altcoin has made gains of 40% from $7.28 this time last Friday. Nano has been a solid performer over the past month almost doubling in price from $5.2 this time last month. Against bitcoin Nano has made a 16% gain on the day to 105500 satoshis from 91000 sats this time yesterday. Weekly gains on BTC have been an impressive 33% from 79000 satoshis this time last week.
Asian cryptocurrency trading update: nano lifted on binance giveaway

The rebranded RaiBlocks has had a rough ride with the BitGrail saga but seems to have shaken off any doubts and has recovered well. A Binance giveaway of 15,000 tokens has boosted Nano over the past 24 hours and prizes for Nano traders on the exchange have been an incentive to load up;

Unsurprisingly Binance leads the way with Nano trade taking almost 95% of the total volume. That trade volume has jumped from around $24 million to over $125 million in 24 hours and continues to climb at the time of writing. Nano has found its way back into the top 25 and currently sits at 23rd with a $1.35 billion market cap.

Total crypto market capitalization has climbed again today by 2.7% to $452 billion. Trade volume has also climbed from $23 billion this time yesterday to $31 billion at the moment. Other altcoins with strong gains during the morning’s Asian trading session include Ethereum, Iota, and Bytecoin.

More on Nano can be found here: https://nano.org/en

FOMO Moments is a section that takes a daily look at the top 25 altcoins during the Asian trading session and analyses the best performing one, looking for trends and possible fundamentals.

Published at Fri, 04 May 2018 05:00:55 +0000

Altcoins
Previous Article

Coinbase Says Its an $8 Billion, ‘Self-Sustaining’ Company

Next Article

These ICO Investors Are Getting Their Money Back – And It's Not Clear Why

You might be interested in …

Ether Price Analysis: Bullish Momentum Seems to Be Waning

Ether Price Analysis

Early in the summer, the entire crypto market took a sustained, downward move that left ETH-USD dropping in value by approximately 60 percent. At the start of the bear market, the price of ether was $360 and ultimately found lows bottoming out in the $130s. As of today, ETH-USD market price is in the mid $330s, and the volume shows no signs of new investment interest:

Figure_1 (2).JPGFigure 1: ETH-USD, 12-Hour Candles, Bitfinex, Bear Market Fibonacci Retracement Values

Although the high of the market was in the upper $400s, my personal opinion is that it’s best to view the market beginning within the $360 values. This price range represents the market acceptance of the impending bear market. Currently, ether is pushing new local highs on decreasing volume. Leading into this push, ETH-USD spent a couple weeks consolidating around the $300 range before ultimately breaking out to $340.

Let’s first take a look at the macro trend market indicators and then zoom in to the smaller timescales:

Figure_2 (2).JPGFigure 2: ETH-USD, 6-Hour Candles, Bitfinex, Current Bull Run

Three major indications of bullish exhaustion are visible in the $300 values:

  1. Price growth on decreasing volume

  2. MACD divergence

  3. RSI divergence

The market is currently struggling to make new highs, and the classic signs of bullish momentum loss are seen quite clearly on the RSI and MACD.

Zooming in to the 1-hour candle trend, we see further signs of bullish exhaustion:

Figure_3 (2).JPGFigure 3: ETH-USD, 1-Hour Candles, Bitfinex, Micro Trend

The MACD and RSI momentum divergence is visible within a bearish pattern known as an “Ascending Wedge.” Currently, the market is attempting to break to the bottom of the wedge and shows moderate signs of sell volume increasing upon the breakout point. A sustained breakdown of this pattern would give an approximate price target of the low $300 values.

To understand whether the downward move is a sustained move or merely a support test, we will have to observe the volume trend in correlation with price movement. Sustained volume growth within a downward move indicates less confidence in higher values, and higher interest in the lower values.

A sustained move on the micro trend could lead to a test of a potential macro trend on the high timescales. Similar to the 1-hour candle trend, the 4-hour candle trend also shows an Ascending Wedge:

Figure_4 (1).JPGFigure 4: ETH-USD, 4-Hour Candles, Bitfinex, Macro Ascending Wedge

A breakdown of this rising wedge could have a significant price target in the $250–260 range. Again, when confirming the macro trend breakdown, it is a good idea to watch the volume to confirm a trend and reduce the risk of a market fakeout.

Whether the market is interested in a sustained move to lower values remains to be seen. However, a couple things are very clear: the overall market volume is decreasing with every push to higher values, and the RSI and MACD on both macro and micro scales are showing bullish momentum loss.

Summary:

  1. Bullish momentum loss is visible across both the micro and macro trends.

  2. Currently, the ETH-USD 1-hour candle trend is testing the lower boundary of a rising wedge and has yet to have a confirmed breakdown of the pattern.

  3. A breakdown in price in the current market could lead to a sustained bearish market on the macro scale.

Trading and investing in digital assets like bitcoin, bitcoin cash and ether is highly speculative and comes with many risks. This analysis is for informational purposes and should not be considered investment advice. Statements and financial information on bitcoin Magazine and BTC Media related sites do not necessarily reflect the opinion of BTC Media and should not be construed as an endorsement or recommendation to buy, sell or hold. Past performance is not necessarily indicative of future results.

The post Ether Price Analysis: Bullish Momentum Seems to Be Waning appeared first on Bitcoin Magazine.