- Tron price rallied recently and traded above the $0.0275 and $0.0340 resistances against the US Dollar.
- There is a major bullish trend line in place with support at $0.0240 on the 4-hours chart (data feed via Bitfinex).
- The price remains supported near $0.0240 and $0.0220 and it could soon bounce back above $0.0280.
Tron price blasted higher this week above $0.0300 and later trimmed most gains against the US Dollar and bitcoin [BTC]. TRX still remains supported and it may soon climb higher again.
Tron Price Analysis
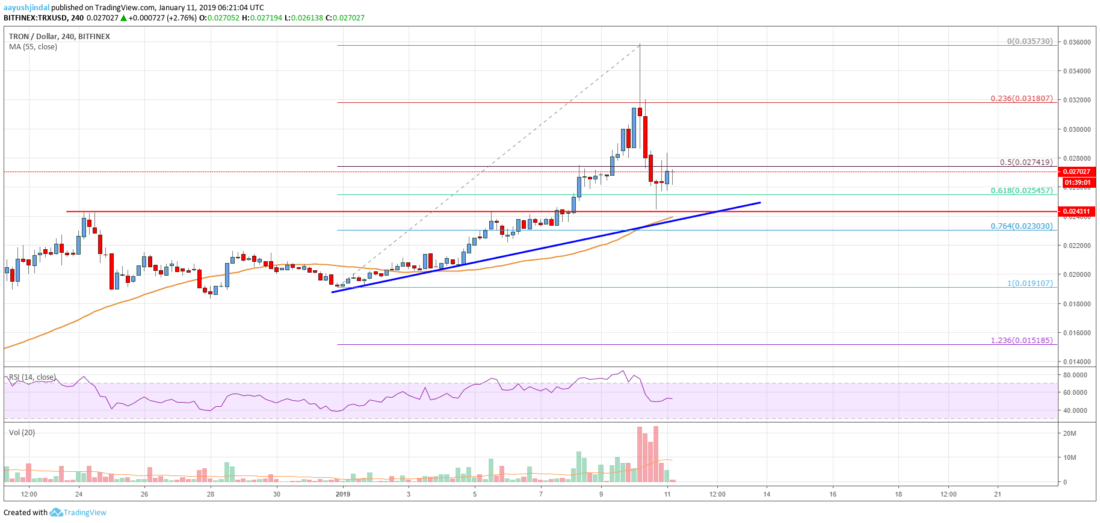
This week, there was a sharp upward move from the $0.0220 support in tron price against the US Dollar. The TRX/USD pair gained traction and broke the $0.0275 and $0.0340 resistance levels. The price traded close to the $0.0360 level and a high was formed at $0.0357. Later, , and declined heavily and dragged tron into a bearish zone. It broke the $0.0320 and $0.0300 support levels. Moreover, there was a break below the 50% Fibonacci retracement level of the last wave from the $0.0191 low to $0.0357 high.
However, the decline was protected by the $0.0250 and $0.0240 support levels. There is also a major bullish trend line in place with support at $0.0240 on the 4-hours chart. The trend line coincides with the $0.0242 pivot and the 55 simple moving average (4-hours). Finally, the 61.8% Fibonacci retracement level of the last wave from the $0.0191 low to $0.0357 high is also at $0.0254. Therefore, as long as the price is above the $0.0240 and $0.0220 support levels, it could resume its bullish moves. On the upside, an initial resistance is at $0.0275 and $0.0280. A close above $0.0280 may trigger moves above $0.0300 in the near term.
The indicates that TRX price is still trading above key supports near $0.0240 and 55 simple moving average (4-hours). Buyers could make another run and lead the price towards $0.0300 and $0.0320.
Technical Indicators
4-hours MACD – The MACD for TRX/USD is moving back in the bullish zone, with a positive bias.
4-hours RSI – The RSI for TRX/USD is still above the 50 level, with a flat structure.
Key Support Level – $0.0240
Key Resistance Level – $0.0280
Published at Fri, 11 Jan 2019 10:00:59 +0000