Key Highlights:
price continue its downtrend;
the bears were in control of the XLM market;
XLM price pulling back is inevitable.
XLM/USD price Long-term Trend: Bearish
Supply levels: $0.13, $0.17, $0.20
Demand levels: $0.10, $0.06 $0.04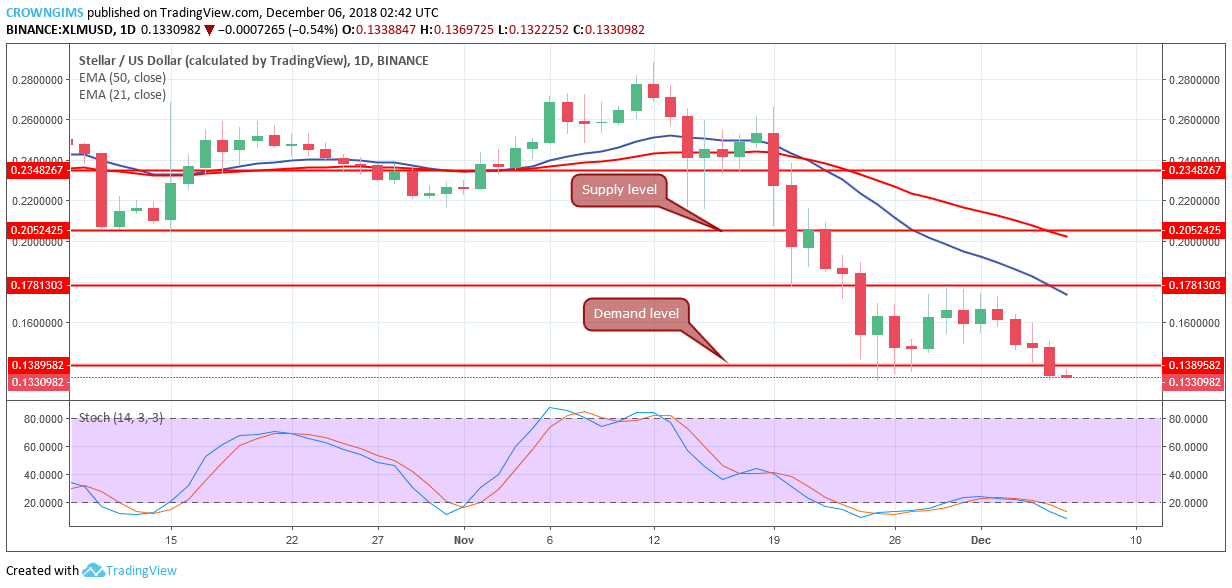 Stellar is in a bearish trend on the long-term outlook. Stellar price has been on a bearish trend for more than two weeks. It fell from $0.23 price level to $0.13 last week demand level. The crypto consolidated within the range of $0.17 and $0.13 supply level; there was not much significant movement outside this range until December 5, when the bearish Japanese candle formed was strong enough to penetrate the strong demand level of $0.13 and closed below it.
The Stellar price is currently facing another strong demand level of $0.10. There is a tendency for the coin to continue in its bearish movement as XLM price still trading below the 21-day EMA and 50-day EMA. The Stochastic Oscillator period 14 is below 20 level with signal lines well separated facing south indicates that falling of XLM price may continue.
XLM/USD Price Medium-term Trend: Bearish
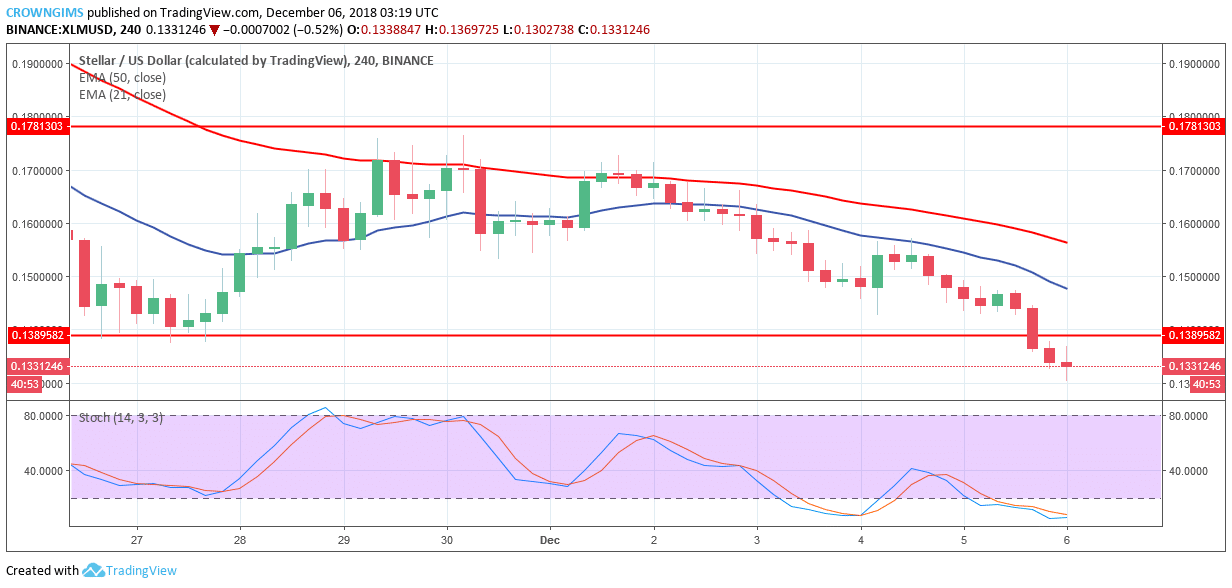 XLM continue in its bearish trend on the medium-term outlook. On the 4-Hour chart, XLM price is in a strong bearish trend as it is falling with little interruption from the bulls. The strong demand level of $0.13 was broken downside last week and Stellar price may have its low at the demand level of $0.10 as more strong bearish candles are forming which indicates that bears’ pressure is increasing.
XLM price is under 21-day EMA and 50-day EMA, the two EMAs are fanned apart with Stochastic Oscillator period 14 below 20 levels pointing down, connotes further selling of XLM price. The trader should be aware that as the Stochastic Oscillator is at the oversold region, a pullback is inevitable.
