Key Highlights
- Ripple price recovered nicely from the $0.5180 swing low against the US dollar.
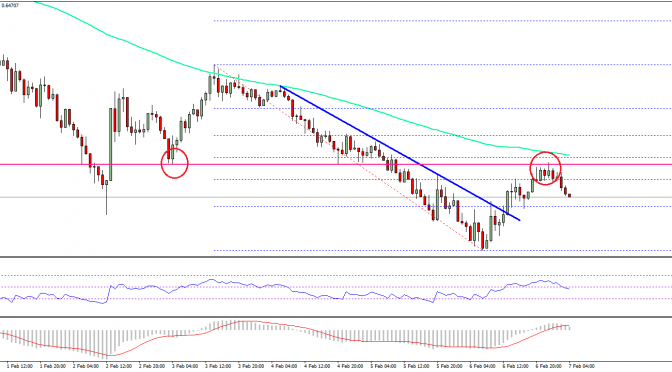
- There was a break above yesterday’s highlighted crucial bearish trend line with resistance at $0.6100 on the hourly chart of the XRP/USD pair (data source from SimpleFx).
- The pair faced a major barrier on the upside near $0.7250 and is currently moving lower.
Ripple price recovered in a constructive fashion against the US Dollar and bitcoin. XRP/USD traded above the $0.6500 level, but it is currently facing a major barrier at $0.7250.
Ripple Price Resistance
Yesterday, we saw a in Ripple price from well above $0.7000 against the US Dollar. The price fell sharply and traded below the $0.6600 and $0.6000 support levels. It even broke the $0.5550 level and traded close to the $0.5000 level. A low was formed at $0.5180 from where the price started an upside correction. It moved above the 23.6% Fib retracement level of the last decline from the $0.9676 high to $0.5180 low.
More importantly, there was a break above yesterday’s highlighted crucial bearish trend line with resistance at $0.6100 on the hourly chart of the XRP/USD pair. The pair traded above the $0.7000 level. However, the upside move faced a major barrier near $0.7250. The mentioned $0.7250 level was a support earlier and now it is acting as a . XRP also failed just below the 50% Fib retracement level of the last decline from the $0.9676 high to $0.5180 low.
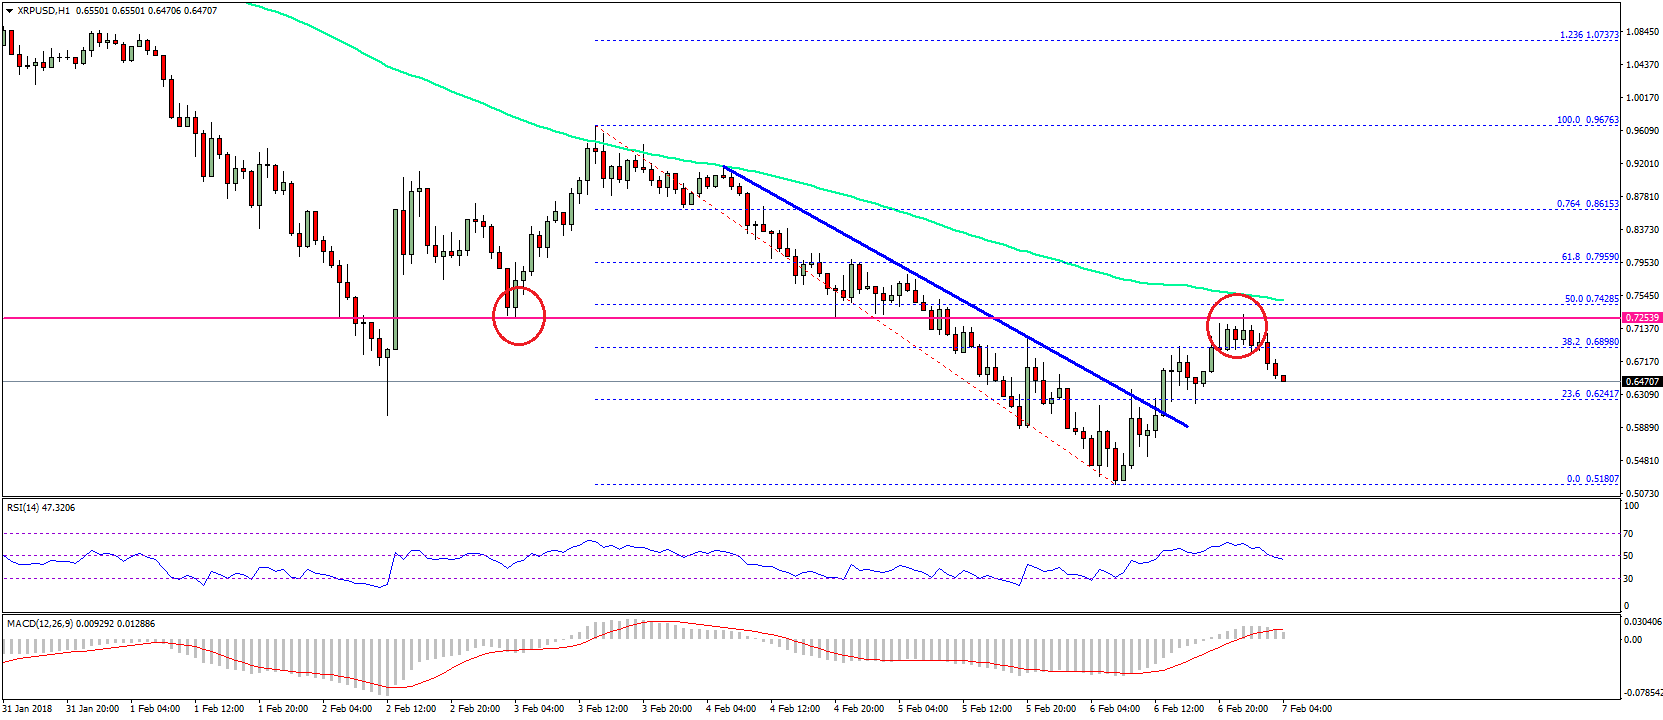
The pair is once again moving lower and is currently trading below $0.7000. An initial support on the downside is at $0.6200, followed by the $0.6000 level. On the upside, a break above the $0.7250 level is needed for more gains in the near term.
Looking at the technical indicators:
Hourly MACD – The MACD for XRP/USD is back in the bullish zone, but with no pace.
Hourly RSI (Relative Strength Index) – The RSI for XRP/USD is struggling to stay above the 50 level.
Major Support Level – $0.6000
Major Resistance Level – $0.7250
Charts courtesy –
Published at Wed, 07 Feb 2018 06:30:38 +0000
Analysis