Key Highlights
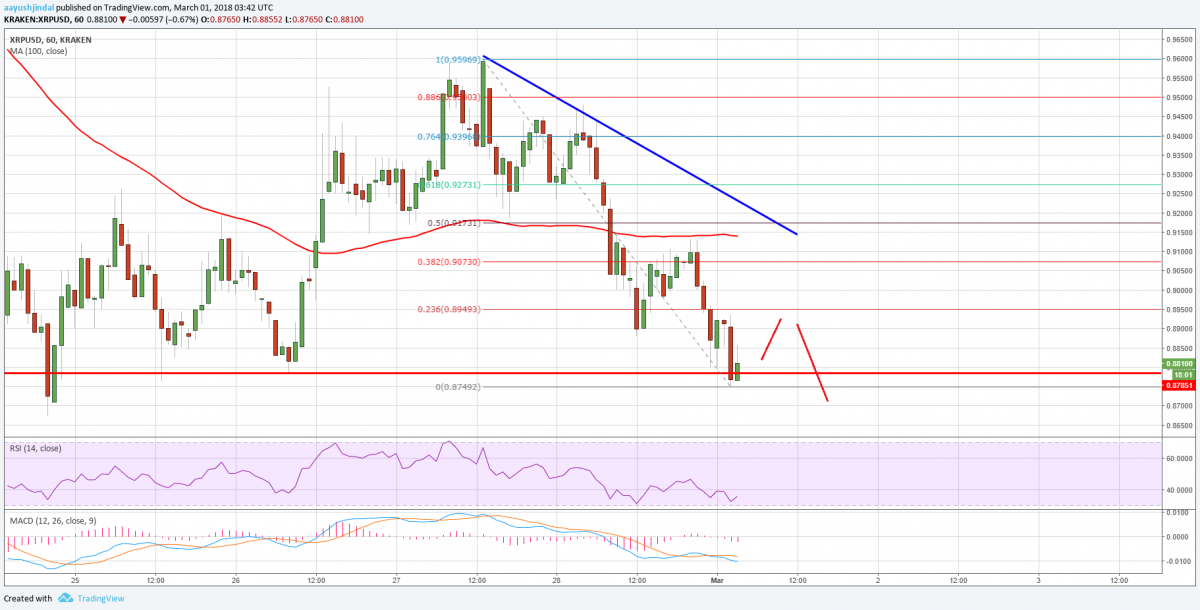
- Ripple price failed to move higher and declined below the $0.9000 support against the US dollar.
- There is a connecting bearish trend line forming with resistance at $0.9100 on the hourly chart of the XRP/USD pair (data source from Kraken).
- The pair is currently at a risk of more declines below the $0.8800 and $0.8600 support levels.
Ripple price is struggling to gain upside momentum against the US Dollar and bitcoin. XRP/USD is testing the $0.8800 support and it decline further in the near term.
Ripple Price Resistance
There was a from the $0.8900 swing low in Ripple price against the US Dollar. The price traded higher, but it was not able to break the $0.9100 resistance. It also failed to near the 100 hourly simple moving average and declined below $0.9000. There was an hourly close below the $0.9000 support and the 100 SMA, which is a bearish sign.
The recent low was formed at $0.8749 and the price seems to be holding the $0.8800 support. An initial resistance on the upside is around the 23.6% Fib retracement level of the last decline from the $0.9596 high to $0.8749 low. There is also a connecting bearish trend line forming with resistance at $0.9100 on the hourly chart of the XRP/USD pair. Moreover, the trend line resistance is close to the 38.2% Fib retracement level of the last decline from the $0.9596 high to $0.8749 low. Therefore, if the , it may face sellers near the $0.9100 resistance level.
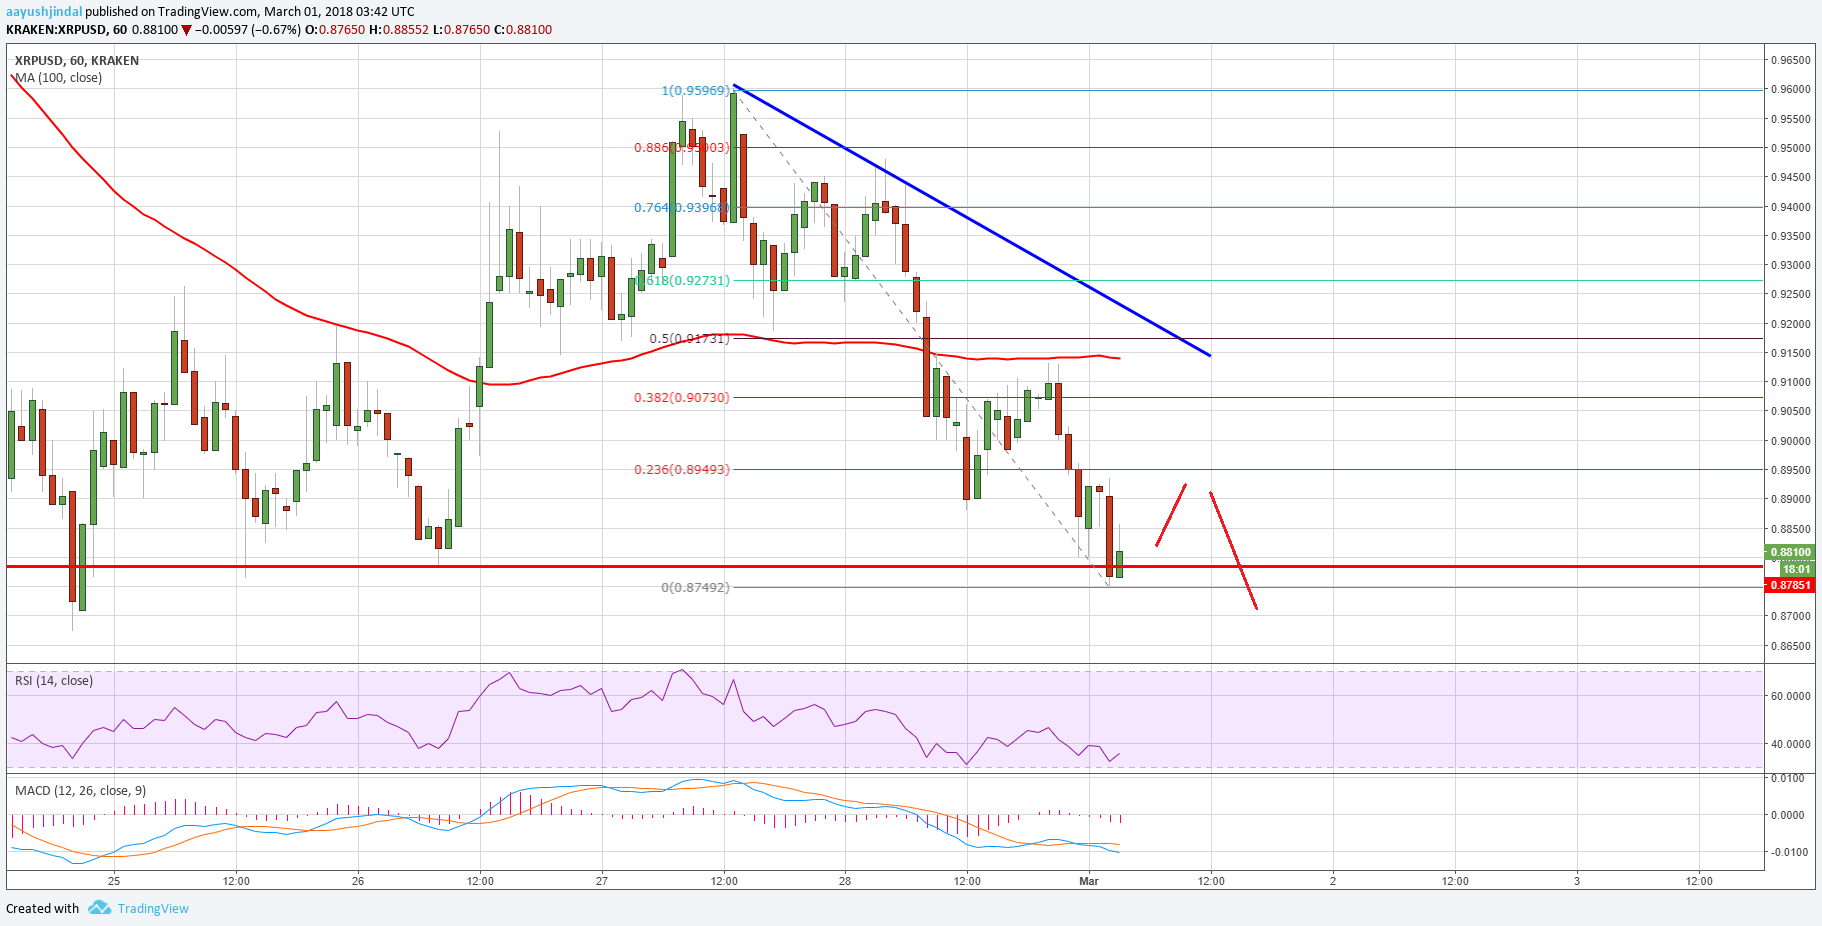
On the downside, a break below the $0.8800 support could ignite more declines. The next major support is at $0.8400 followed by the $0.8200 level.
Looking at the technical indicators:
Hourly MACD – The MACD for XRP/USD is mostly in the bearish zone with negative signs.
Hourly RSI (Relative Strength Index) – The RSI for XRP/USD is currently well below the 50 level.
Major Support Level – $0.8800
Major Resistance Level – $0.9100
Charts courtesy –
Published at Thu, 01 Mar 2018 06:30:05 +0000
Analysis