- Ripple price started a downside correction and traded below the $0.3050 support against the US dollar.
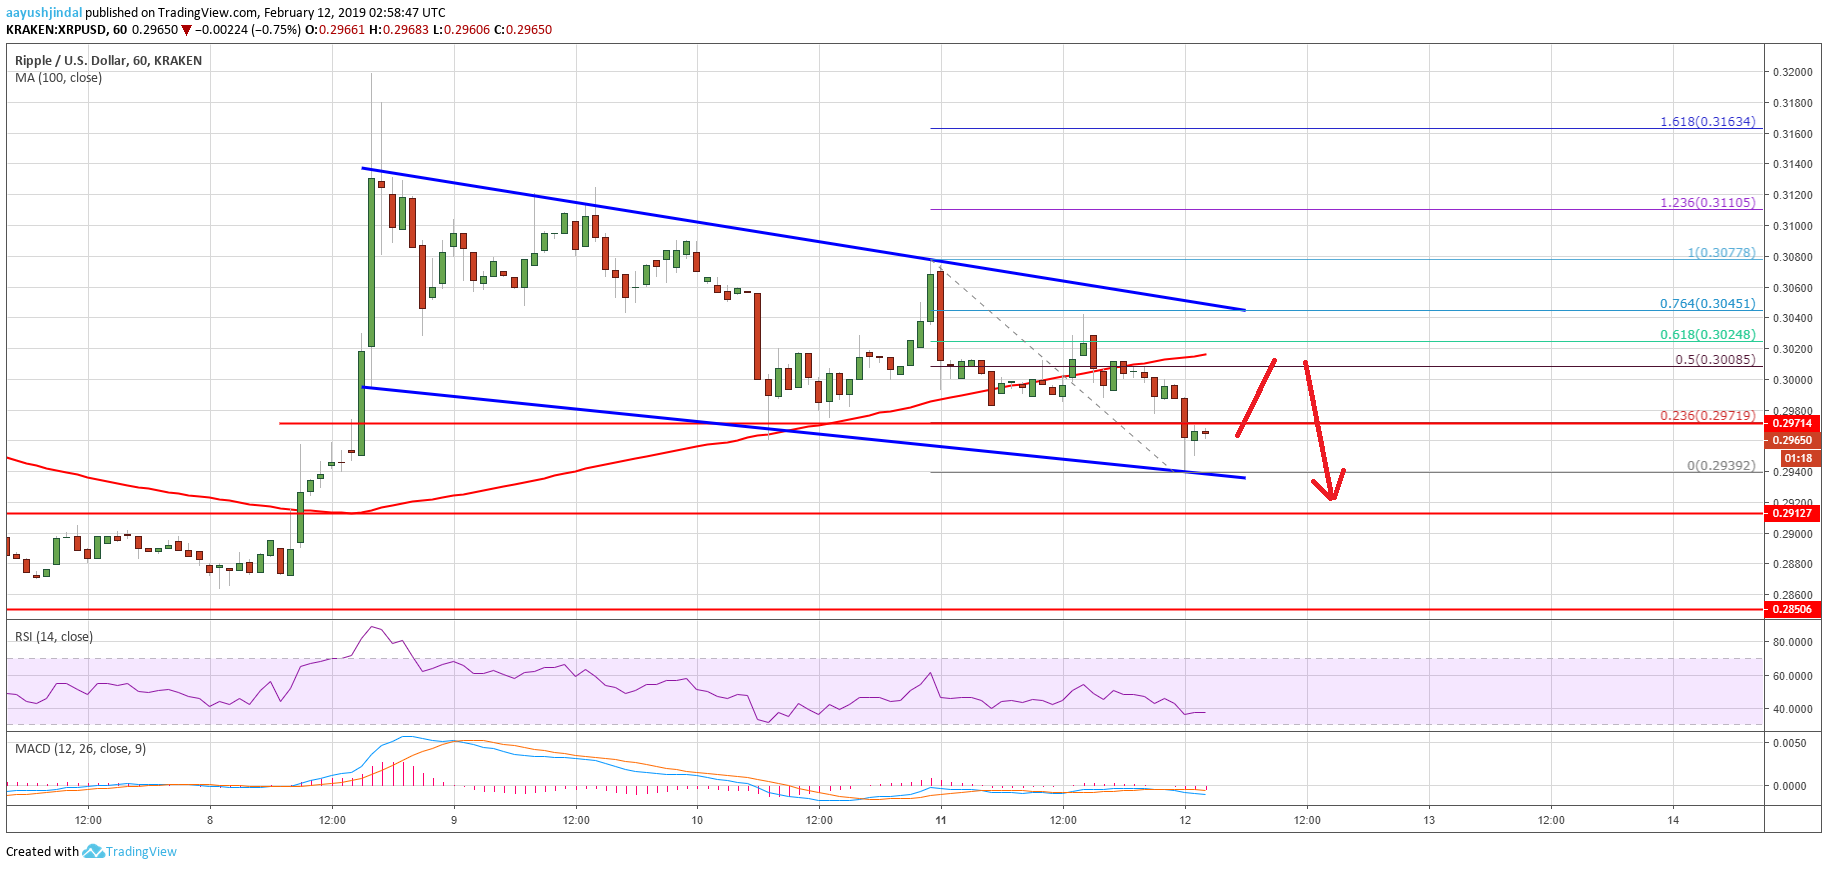
- There is a major declining channel in place with resistance near $0.3040 on the hourly chart of the XRP/USD pair (data source from Kraken).
- The pair is under pressure and it seems to be approaching the key $0.2915 support area.
Ripple price corrected most its gains against the US Dollar and bitcoin. XRP/USD settled below $0.3050 and it could extend the current correction towards the $0.2915 support area.
Ripple Price Analysis
Recently, ripple price after trading as high as $0.3200 against the US Dollar. The XRP/USD pair traded below the $0.3100 and $0.3050 support levels. Sellers pushed the price below the $0.3000 support and the 100 hourly simple moving average. Besides, there was a break below the 61.8% Fib retracement level of the last leg from the $0.2865 low to $0.3200 high. It seems like the price trimmed most of its recent gains and it could extend the decline to $0.2915 in the near term.
It traded as low as $0.2939 recently and it is currently correcting higher. An initial resistance is near the $0.3000 level and the 100 hourly SMA. Besides, the 50% Fib retracement level of the recent drop from the $0.3077 high to $0.2939 low is also near $0.3000. Above this, the price could struggle near the $0.3025 level. The is near $0.3050 and the 76.4% Fib retracement level of the recent drop from the $0.3077 high to $0.2939 low. Finally, there is a major declining channel in place with resistance near $0.3040 on the hourly chart of the XRP/USD pair.
Looking at the , ripple price is clearly following a declining pattern from the $0.3200 swing high. The price could remain under pressure and it may even slide towards the $0.2915 support. To recover, the price must break the $0.3000 and $0.3050 resistance levels.
Technical Indicators
Hourly MACD – The MACD for XRP/USD is currently placed in the bearish zone.
Hourly RSI (Relative Strength Index) – The RSI for XRP/USD moved below the 40 level, with a bearish angle.
Major Support Level – $0.2915
Major Resistance Level – $0.3050
Published at Tue, 12 Feb 2019 05:00:11 +0000