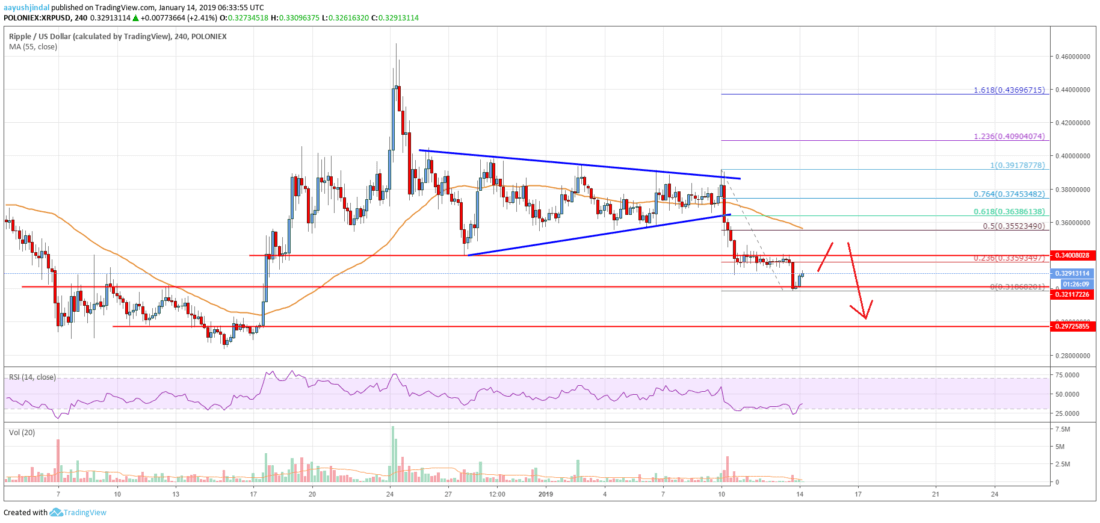
- Ripple price declined recently and broke an important support at $0.3400 against the US dollar.
- There was a break below a crucial contracting triangle with support at $0.3620 on the 4-hours chart of the XRP/USD pair (data source from Poloniex).
- The pair tested the key $0.3185 support, below which it could test the $0.2975 support.
Ripple price moved into a bearish zone below $0.3400 against the US Dollar. XRP must hold $0.3185 or it might decline towards $0.2975 and $0.2920 in the near term.
Ripple Price Analysis
In the last analysis, we discussed a if ripple price clear the $0.3900 resistance against the US Dollar. However, the XRP/USD pair struggled to gain momentum above the $0.3900 and $0.3920 levels. As a result, there was a bearish reaction and the price declined below the $0.3800 and $0.3600 support levels. The decline was strong as the price broke the key support near $0.3620 and the 55 simple moving average (4-hours).
More importantly, there was a break below a crucial contracting triangle with support at $0.3620 on the 4-hours chart of the XRP/USD pair. The price even broke the $0.3200 level and tested the next main support at $0.3185. A low was formed near $0.3185 and the price later started an upside correction. An initial resistance is near the $0.3360 level. It coincides with the 23.6% Fib retracement level of the recent downside move from the $0.3917 high to $0.3185 low. However, the is near the $0.3550 level and the 55 simple moving average (4-hours). The 50% Fib retracement level of the recent downside move from the $0.3917 high to $0.3185 low is also positioned near $0.3550.
Looking at the , ripple price is trading above the key $0.3185 support. It could correct higher in the short term, but buyers are likely to struggle near $0.3550. On the downside, if there is a break below $0.3185, the next important support is at $0.3000 and $0.2975.
Technical indicators
4-hours MACD – The MACD for XRP/USD is showing negative signs in the bearish zone.
4-hours RSI (Relative Strength Index) – The RSI for XRP/USD is now well below the 40 level.
Key Support Level – $0.3185
Key Resistance Level – $0.3550
Published at Mon, 14 Jan 2019 10:00:57 +0000