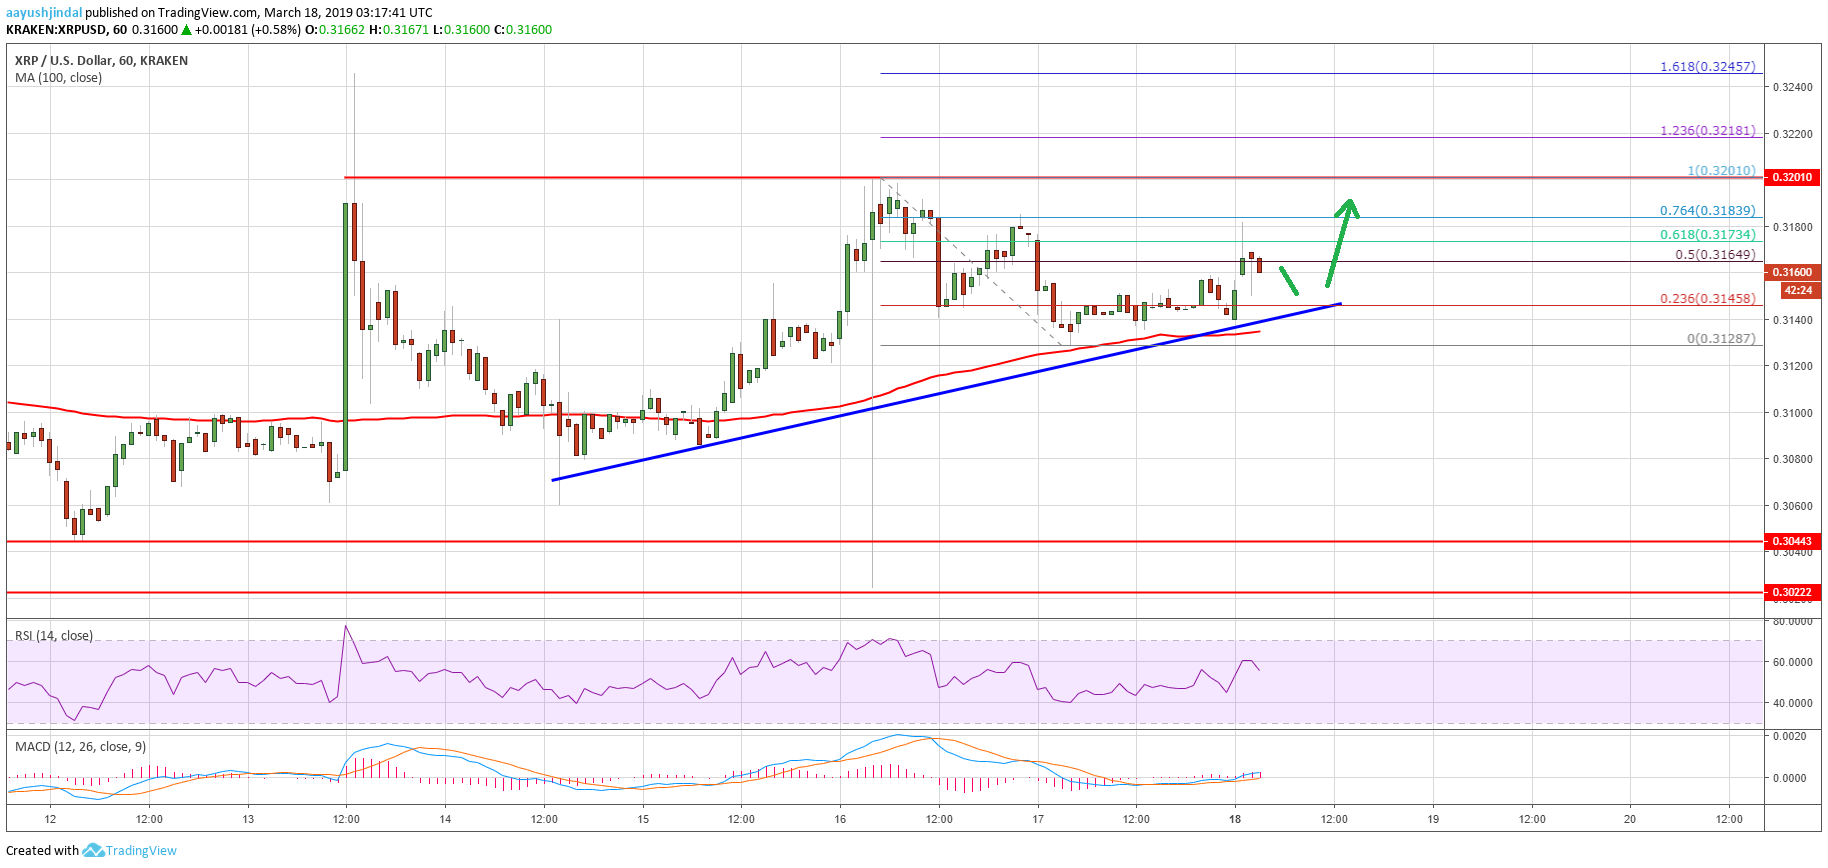
- Ripple price struggled to break the $0.3200 resistance level and corrected lower against the US dollar.
- The price declined below the $0.3150 level and tested the $0.3125 support area.
- There is a key bullish trend line formed with support at $0.3145 on the hourly chart of the XRP/USD pair (data source from Kraken).
- The pair must clear the $0.3180 and $0.3200 resistance levels to start a solid bullish wave towards $0.3300.
Ripple price is trading key supports against the US Dollar and bitcoin. XRP/USD must clear the $0.3200 resistance area to kick start a fresh bullish wave towards $0.3280 and $0.3300.
Ripple Price Analysis
This past week, we saw a in ripple price from the $0.3000 support against the US Dollar. The XRP/USD pair traded above the $0.3120 and $0.3150 resistance levels. There was also a close above the $0.3120 level and the 100 hourly simple moving average. Finally, there was a spike towards the $0.3250 level before the price started a downside correction. It traded below the $0.3200 and $0.3180 levels. However, the $0.3125 support and the 100 hourly SMA acted as a decent barrier for sellers.
A low was formed at $0.3128 and later the price . It moved above the $0.3140 level and the 50% Fib retracement level of the recent drop from the $0.3201 high to $0.3128 low. However, the upside move was capped by the $0.3180 resistance. It also represents the 61.8% Fib retracement level of the recent drop from the $0.3201 high to $0.3128 low. Should ripple break the $0.3180 resistance, it may struggle to clear the $0.3200 resistance. Finally, if there is an upside break above $0.3200, the price may rally towards $0.3300.
On the downside, there are many supports above $0.3125. There is also a key bullish trend line in place with support at $0.3145 on the hourly chart of the XRP/USD pair. If there is a downside wave, the trend line support and 100 hourly SMA may hold losses near $0.3140. If there is a break below the $0.3128 swing low, the price could move back in the bearish zone.
Looking at the , ripple price is trading above key supports near $0.3140. As long as buyers are active above $0.3125, there are chances of more upsides. The main resistance is at $0.3200, above which the price is likely to climb towards $0.3300 or even $0.3320.
Technical Indicators
Hourly MACD – The MACD for XRP/USD is currently placed nicely in the bullish zone.
Hourly RSI (Relative Strength Index) – The RSI for XRP/USD tested the 60 level and it is currently correcting lower.
Major Support Levels – $0.3145, $0.3140 and $0.3125.
Major Resistance Levels – $0.3180, $0.3200 and $0.3250.
Published at Mon, 18 Mar 2019 05:00:24 +0000