November 8, 2026

Capitalizations Index – B ∞/21M

Ripple Price Analysis: XRP Moon-sling Depend on Adoption Levels

Ripple price analysis: xrp moon-sling depend on adoption levels

Ripple Price Analysis: XRP Moon-sling Depend on Adoption Levels

  • Ripple Price technically bullish
  • Brad Garlinghouse confident of more bank “switch.”
  • Transaction volumes low—averaging 26 million as XRP consolidate

The CEO of Ripple the company is satisfied and expecting the total Bank tally to increase by year’s end. So far 200 banks use the network meaning Ripple controls two percent of SWIFT’s market share.

Ripple Price Analysis

Fundamentals

The Ripple community might be over the top, excited about the progress. However, the truth of is, RippleNet—the underlying ledger that holds together xCurrent, xRapid and xVia—pales in comparison with SWIFT—a 40-year global payment network formed by banks. With enthusiasm, Brad Garlinghouse said banks might be ready to “flip the switch” and enjoy a cheap and convenient system, but at 200 versus 10,000—banks using SWIFT, Ripple has managed to clip a mere two percent of SWIFT’s market share.

What’s more, of the 200 banks, 13 companies are using the xRapid system which leverages on XRP as a liquidity tool. Therefore, all things constant, it appears as if there is an XRP undervaluation and if it remains as it is, speculators think Ripple is the next “Amazon.” The only distinction, in this case, it that it will have a fair valuation and a trillion-dollar capitalization.

Candlestick ArrangementsRipple

With a market cap of $13,349 million, XRP is the second most valuable coin. Nevertheless, it could lose this position more so if there are rapid ETH price gains in the next 24-36 hours—the network is upgrading. However, since candlestick arrangements favor bulls, our previous XRP/USD trade plan is valid.

Notice that XRP found support mid-range, just above 30 cents meaning bulls have the upper hand. For assurance, we shall trade in line with Sep 2018 gains and that demands patience until after there are substantial gains above 40 cents—a key resistance trend line marking the 61.8 percent Fibonacci retracement level marking Sep 2018 high low. Break above should be accompanied by above average volumes.

After that, both sets of traders should aim at 80 cents and later $1.65. On the flip side, losses below 25 cents invalidate our bullish overview.

Technical Indicators

Thus far, our point of reference is Jan 10 bear bar—83 million versus 30 million. Compared to recent averages of 26 million, it is clear that trading volumes are tapering and for gains above 40 cents, supporting volumes should not only exceed 80 million but equal to or above 123 million or Dec 24 volumes.

Published at Tue, 15 Jan 2019 17:00:56 +0000

Previous Article

Fasanara Capital – Markets In Critical Transformation, Chaotic Behaviour Has Just Began

Next Article

What We Know About Google Ads Allegedly Blacklisting ‘Ethereum’ as a Keyword

You might be interested in …

Re: What to do?

Re: What to do? So what should one do when the price is at a peak or so high as it is at the moment, $1250+ right now. Is it time to cash in? It […]

Bitcoin Price Analysis: Bitcoin’s All-Time High Tests a Historic Reversal Point

Bitcoin Price Analysis

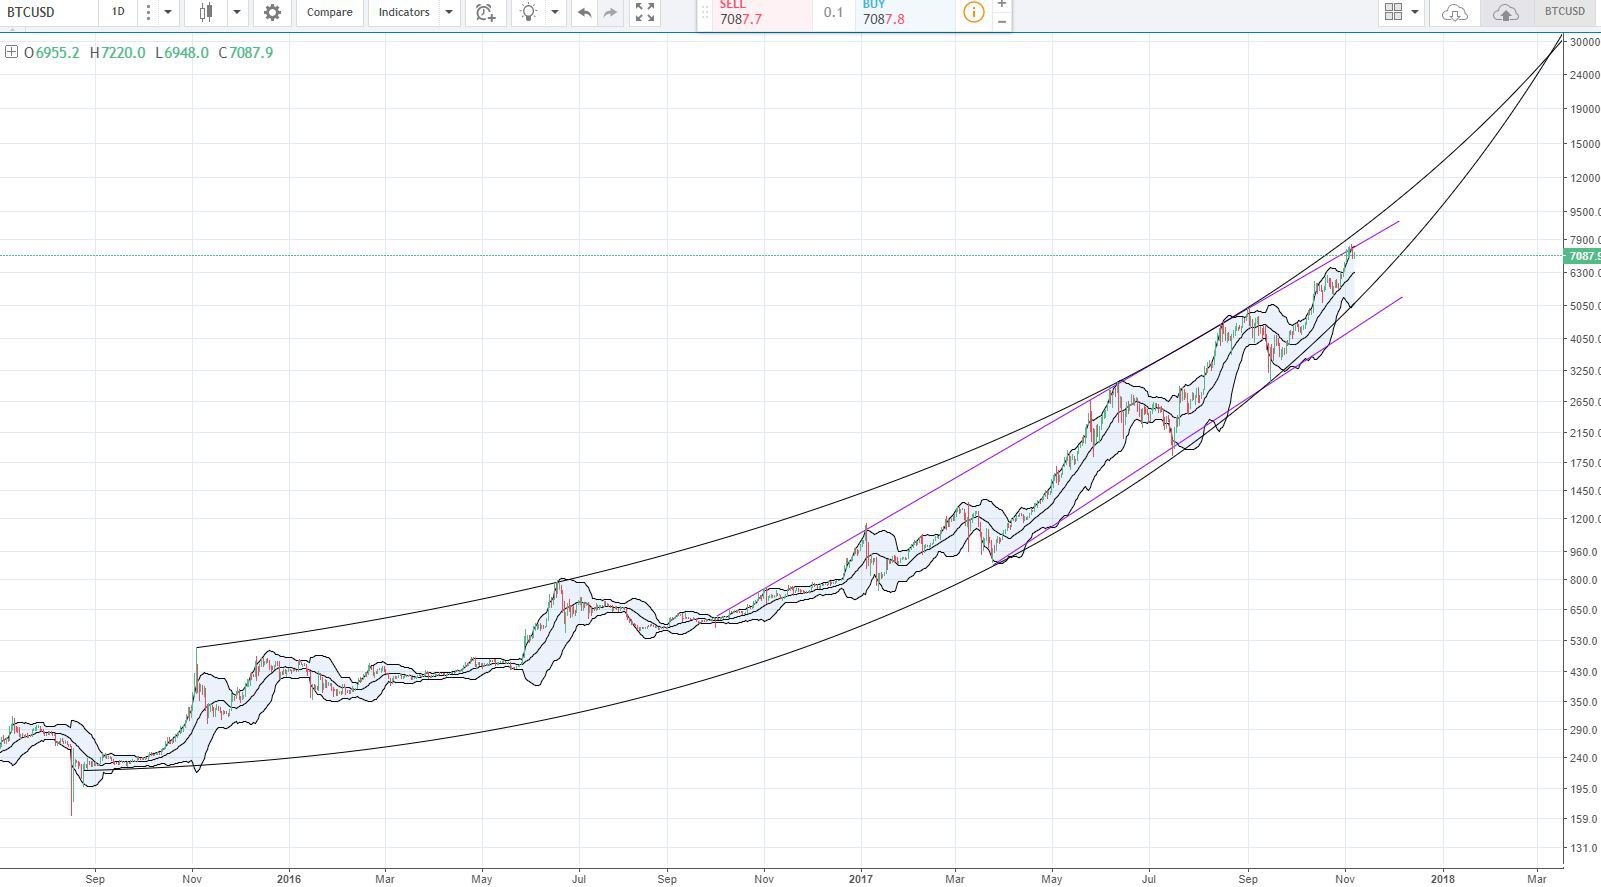
For months on end, BTC-USD had a strong bullish rally that has been well confined between both a linear ascending channel and (on a macro scale) a parabolic curve:

Figure_1 (18).JPGFigure 1: BTC-USD, 1-Day Candles, Linear and Parabolic Trendlines

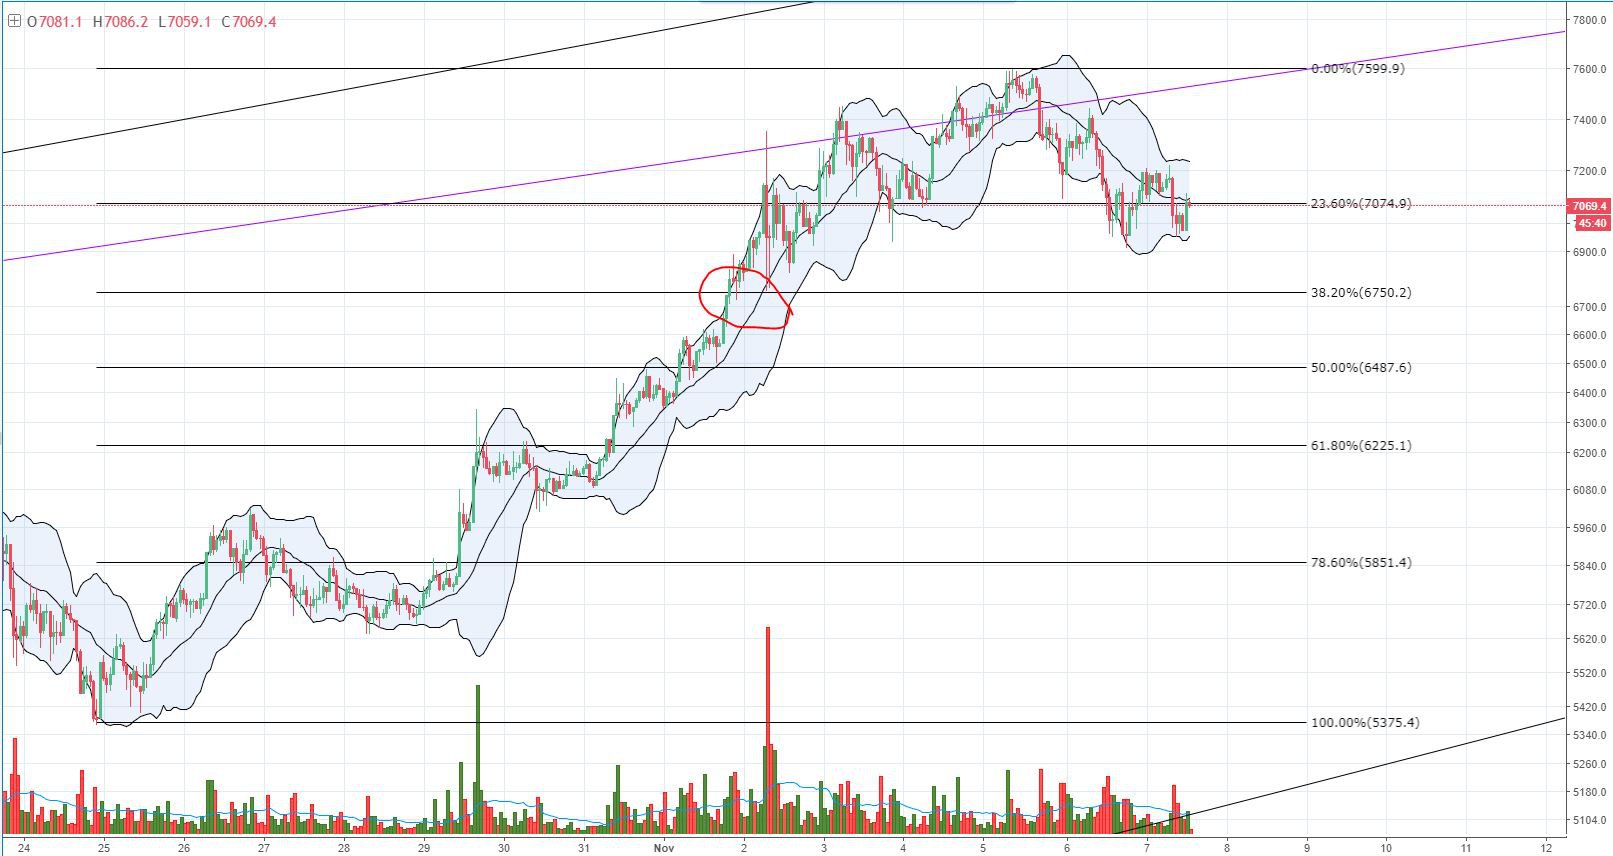
After a very strong, bullish rally, bitcoin managed to settle on a new all-time high in the $7,500s. This price peak bounced right off the upper linear ascending trendline shown in Figure 1. Historically, every time bitcoin has touched the upper ascending trendline, the market has gone through a corrective phase and entered into a relatively strong bearish reversal. At the time of this article, bitcoin is currently testing key, macro support of the lower $7,000 price range:

Figure_2 (15).JPGFigure 2: BTC-USD, 1-Hour Candles, Macro Support

The 23% Fibonacci support has been a point of interest in the market’s history and will prove to be strong support. BTC-USD has attempted to break this support level a couple of times already and we are currently making a third test. A break below this level of support could send the price down to the 38% retracement values and test the $6,700 prices. However, if we look at the previous price action (the red circle) that brought the price upward, we don’t see any consolidation or support in the market’s history. This tells us that the 38% price level most likely won’t prove to be significant support during a potential move downward and we can expect to find stronger support in lower values around the $6,400–$6,500 prices.

Historically, during correction periods, bitcoin has retraced 50–61% of the initial bull run:

Figure_3 (14).JPGFigure 3: BTC-USD, 12-Hour Candles, Retracement Trend

The 50–61% retracement trend has formed a very nice, consistent ascending trendline for the lower support values. Unfortunately in this case, a retracement to the lower trendline would shove us outside the parabolic envelope described in the last bitcoin market analysis. On a macro level, if we do continue on a macro retracement to the 50–61% retracement values, we will likely find support on the lower parabolic curve in the $5,300s.

Overall, bitcoin appears to be experiencing a slow bleed and will likely continue until some buying pressure picks up on the market. In general, the bullish pressure is somewhat exhausted, and if there is a resumption of an uptrend, we will likely see support and bullish continuation off the 23% retracement and $6,500 values outlined in Figure 3.

Right now, bitcoin is in a precarious situation because it’s sitting just above support at the $7,000 level and doesn’t appear to have any interest in climbing back up just yet. Keep an eye on this support level and watch for a rise in volume on the next test of support. If we break this support level, it’s likely to continue downward for several hundred dollars before finding support once again.

Summary:

  1. bitcoin topped out its all-time high at the upper boundary of a macro, linear trendline.

  2. Historically, a test of this trendline has prompted a market correction — it is likely that this trend will continue.

  3. We are testing key support at the $7,000 price level and a move below this support will signal a continuation of the down trend.

Trading and investing in digital assets like bitcoin and ether is highly speculative and comes with many risks. This analysis is for informational purposes and should not be considered investment advice. Statements and financial information on bitcoin Magazine and BTC Media related sites do not necessarily reflect the opinion of BTC Media and should not be construed as an endorsement or recommendation to buy, sell or hold. Past performance is not necessarily indicative of future results.

The post Bitcoin Price Analysis: Bitcoin’s All-Time High Tests a Historic Reversal Point appeared first on Bitcoin Magazine.