- Ripple price remained below the key $0.3400 and $0.3450 resistance levels against the US dollar.
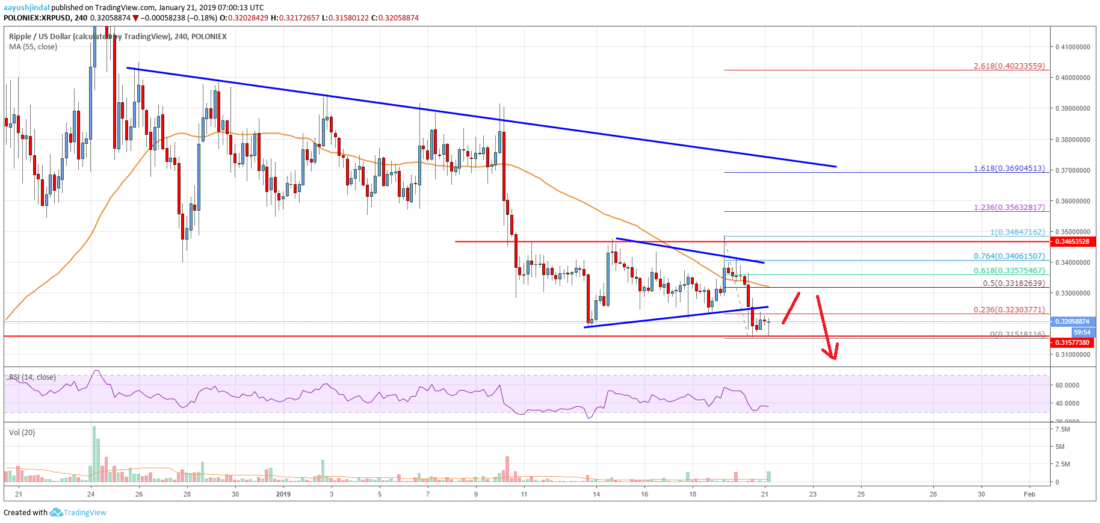
- There was a break below a major contracting triangle with support at $0.3245 on the 4-hours chart of the XRP/USD pair (data source from Poloniex).
- The pair is currently trading well below the $0.3320 support and it remains at a risk of more losses below $0.3150.
Ripple price is under a lot of selling pressure below $0.3320 and $0.3400 against the US Dollar. XRP may perhaps continue to move down below the $0.3100 and $0.3060 supports.
Ripple Price Analysis
There was in ripple price above the $0.3400 and $0.3450 resistances against the US Dollar. The XRP/USD pair settled below the $0.3400 support and the 55 simple moving average (4-hours). This past week, there were mostly range moves above the $0.3200 support. The price made another attempt to clear the $0.3400 and $0.3450 resistances, but it failed. As a result, there was a sharp drop below $0.3320 and $0.3250. XRP even moved below the $0.3200 support and traded as low as $0.3151.
Moreover, there was a break below a major contracting triangle with support at $0.3245 on the 4-hours chart of the XRP/USD pair. At the moment, the pair is consolidating losses above the $0.3160 level. An initial hurdle is near the 23.6% Fib retracement level of the recent slide from the $0.3484 high to $0.3151 low. Above $0.3230, the next major hurdles are near $0.3280 and $0.3300. Besides, the 50% Fib retracement level of the recent slide from the $0.3484 high to $0.3151 low is at $0.3320 along with the (4-hours). Therefore, the price is likely to face a strong selling interest near $0.3300 and $0.3320.
Looking at the , ripple price is trading with a lot of bearish signs below $0.3320. If there is a downside break below $0.3150, the price could accelerate losses towards $0.3100, $0.3060 or $0.3010.
Technical indicators
4-hours MACD – The MACD for XRP/USD is placed heavily in the bearish zone.
4-hours RSI (Relative Strength Index) – The RSI for XRP/USD is now well below the 35 level.
Key Support Level – $0.3150
Key Resistance Level – $0.3320
Published at Mon, 21 Jan 2019 10:00:29 +0000