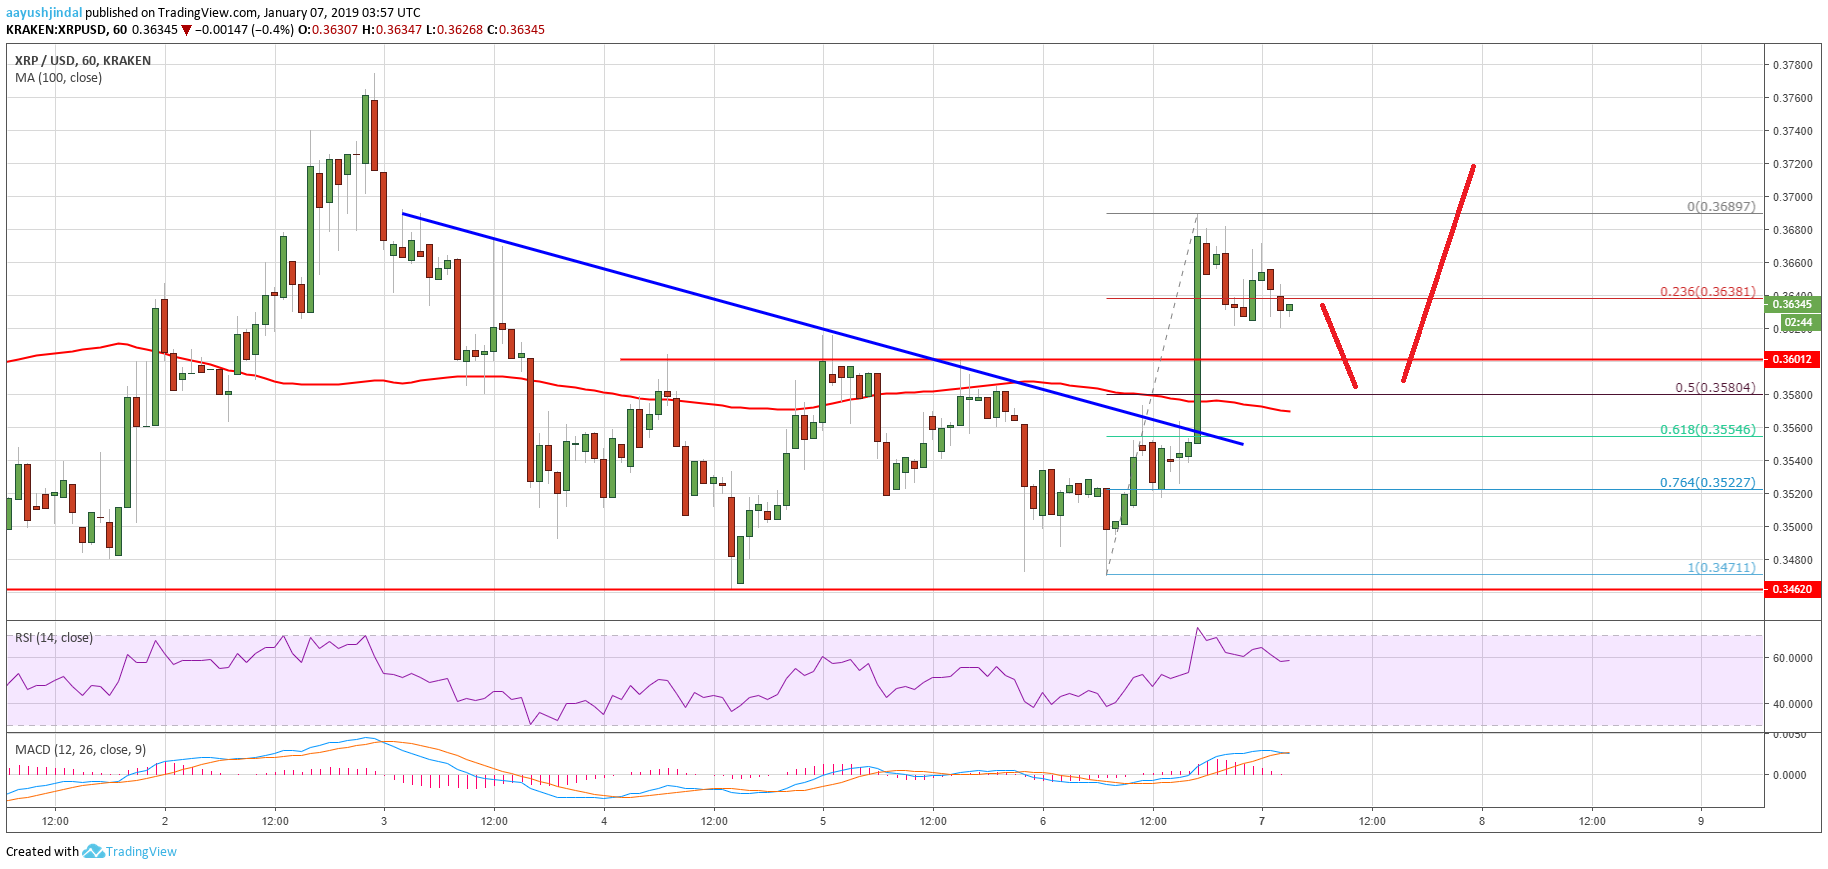
- Ripple price gained traction and moved above the $0.3550 resistance against the US dollar.
- There was a break above a key bearish trend line with resistance at $0.3550 on the hourly chart of the XRP/USD pair (data source from Kraken).
- The pair remains well supported on dips near $0.3600 and it may continue to move higher.
Ripple price formed a decent support and recovered against the US Dollar and BTC. XRP/USD could dip a few points before moving towards $0.3800.
Ripple Price Analysis
Recently, there was a below $0.3750 in ripple price against the US Dollar. The XRP/USD pair traded towards the $0.3460 support, which acted as a buy zone on many occasions. The price found a strong buying interest near $0.3460 and later recovered. It jumped above the $0.3500 and $0.3550 resistance levels. There was even a close above the $0.3600 level and the 100 hourly simple moving average.
Moreover, there was a break above a key bearish trend line with resistance at $0.3550 on the hourly chart of the XRP/USD pair. It traded close to the $0.3700 level and formed a high at $0.3689. Later, it started a downside correction and traded below the $0.3660 level. There was a break below the 23.6% Fib retracement level of the recent wave from the $0.3471 low to $0.3689 high. On the downside, there are many supports near the $0.3600 and $0.3580 levels. Besides, the 50% Fib retracement level of the recent wave from the $0.3471 low to $0.3689 high is placed near the $0.3580 level. Finally, the 100 hourly SMA is near $0.3570 to act as a .
Looking at the , ripple price remains well supported above the $0.3550 level and the 100 hourly SMA. On the upside, the price must break the $0.3680 and $0.3700 resistance levels. The next main resistance is at $0.3800 followed by $0.3820.
Technical Indicators
Hourly MACD – The MACD for XRP/USD is slowly reducing its bullish slope, signaling slowness in buyer’s strength.
Hourly RSI (Relative Strength Index) – The RSI for XRP/USD is still well below the 60 level, which is a positive sign.
Major Support Level – $0.3550
Major Resistance Level – $0.3700
Published at Mon, 07 Jan 2019 05:00:06 +0000