November 19, 2026

Capitalizations Index – B ∞/21M

QTUM looks to be shaping up for a sweet Valentines day

Qtum looks to be shaping up for a sweet valentines day

QTUM looks to be shaping up for a sweet Valentines day

Qtum looks to be shaping up for a sweet valentines day

QTUM is a Chinese coin that’s designed to integrate the BTC and ETH blockchains, it’s in the top 30 market caps, and in addition to having a working product the code contributions haven’t fallen off completely.

All the same, the fundamentals of any of these alts may or may not mean jack shit. Plenty of seemingly decent products die every bull cycle and never see daylight again. Temper any optimism you may have, as pure hype has been the #1 fundamental for any of these shitc- er….altcoins thusfar.

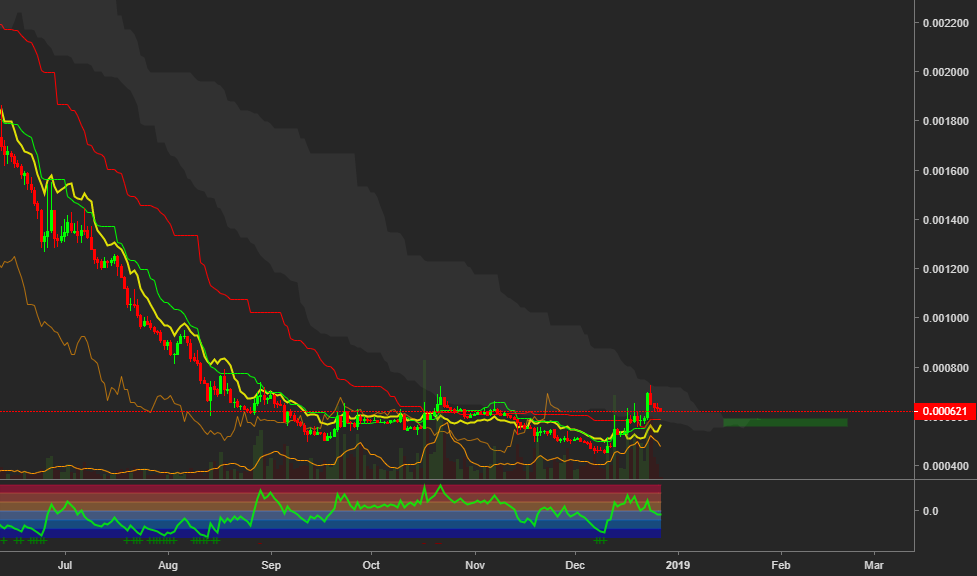
So, looking at the TA it’s been ranging in around it’s ATL long enough to just barely eek out a cloud twist on the 1D. The PA will encounter the bull Kumo in mid-to-late Q1, giving QTUM the potential to be a superb Valentines day surprise. Setting up orders at the bottom of the bear Kumo on up to the green box could be a prudent setup for a position trade.

While this bear market is slowing, it isn’t over by a long shot and QTUM; like nearly all alts, makes its big moves on the back of the crypto ‘blue chip’: bitcoin . While some coins, like WAVES for example have made large moves independent of BTC , the price history of QTUM doesn’t suggest this is likely, even though it has had some bullish action lately and the ATR is showing a bullish-ish signal.

As always none of this is advice, merely observations at most. Keep that risk management heavily in mind, especially playing the hype-based alt markets .

‘If you ain’t makin’ mistakes, you ain’t makin’ decisions’ -Ace Amin

Published at Thu, 27 Dec 2018 03:01:08 +0000

Previous Article

Traders Fair 2019 – Malaysia (Financial Event)

Next Article

Report: India Evaluating Cryptocurrency Legalization Under Strong Regulation

You might be interested in …

Cryptocurrency struggles to get out of the shadow of bear |

Crypto New Media Cryptocurrency struggles to get out of the shadow of bear | Crypto New Media Press The cryptocurrency market has been undergoing a tumultuous run with the proverbial ball in the bear’s court right […]

"coins! " by abcmouse. Com

“Coins!” by ABCmouse.com

“Coins!” by ABCmouse.com http://ABCmouse.com/LearnMore “Coins!” (See below for lyrics) In “Coins!” the entertaining 4-Cent Gents help your child learn the value of a penny, nickel, dime, and quarter, as well as what each coin looks […]

Ether Price Analysis: Eve and Adam Could Be Turning Back the Bulls

Ether Price Analysis

Since bottoming out around $200, ether has spent several weeks bouncing back and forth inside an ascending channel:

Figure_1 (15).JPGFigure 1: ETH-USD, 4-Hour Candles, Ascending Channel

For the last month and a half, ether’s trend has been contained within the bounds of this ascending channel, where it has continued its bullish rally. However, today (as of the time of this article) it is starting to make moves to aggressively test the lower boundary. Specifically, as ether tests this channel, it is forming a potential reversal pattern called an Eve-and-Adam Double Top.

Figure_2 (12).JPGFigure 2: ETH-USD, 1-Hour Candles, Eve-and-Adam Double Top

At the time of this article, ether is attempting to break the neckline (the pink dashed line) of the massive reversal pattern. Should ether break this neckline, the measured move from this pattern is a $30 move downward, which would ultimately shove ether outside the bullish ascending channel it has been trending within. The price target of the Double Top breakout would bring the ETH-USD price into the upper $200s.

On a macro scale, ether has support along the following Fibonacci levels:

Figure_3 (12).JPGFigure 3: ETH-USD, 4-Hour Candles, Fibonacci Levels

Should the ascending channel break, the above Fibonacci levels will provide support and will need to be tested in order to prove a bearish continuation. As of the time of this article, the Double Top mentioned in Figure 2 is sitting right on the 23 percent retracement values where it is making attempts at breaking it. There is strong support at these values, so if ether can break and hold below $315, it will send a strong bearish signal to the market.

Should the Double Top complete, we can expect a test of the 38 percent retracement values following the break of the ascending channel. At this time, the 4-hour MACD is showing strong bearish momentum on a macro scale, and the market is picking up sell volume.

Summary:

  1. For weeks, ether has been trending within an ascending channel.

  2. Ether is currently in the process of making a strong test of the ascending channel via an Eve-and-Adam Double Top reversal pattern.

  3. If the Double Top breaks downward, we can expect a break of the multi-week bullish channel and a test of the 38 percent Fibonacci Retracement values.

Trading and investing in digital assets like bitcoin, bitcoin cash and ether is highly speculative and comes with many risks. This analysis is for informational purposes and should not be considered investment advice. Statements and financial information on bitcoin Magazine and BTC Media related sites do not necessarily reflect the opinion of BTC Media and should not be construed as an endorsement or recommendation to buy, sell or hold. Past performance is not necessarily indicative of future results.

The post Ether Price Analysis: Eve and Adam Could Be Turning Back the Bulls appeared first on Bitcoin Magazine.