Hello traders,
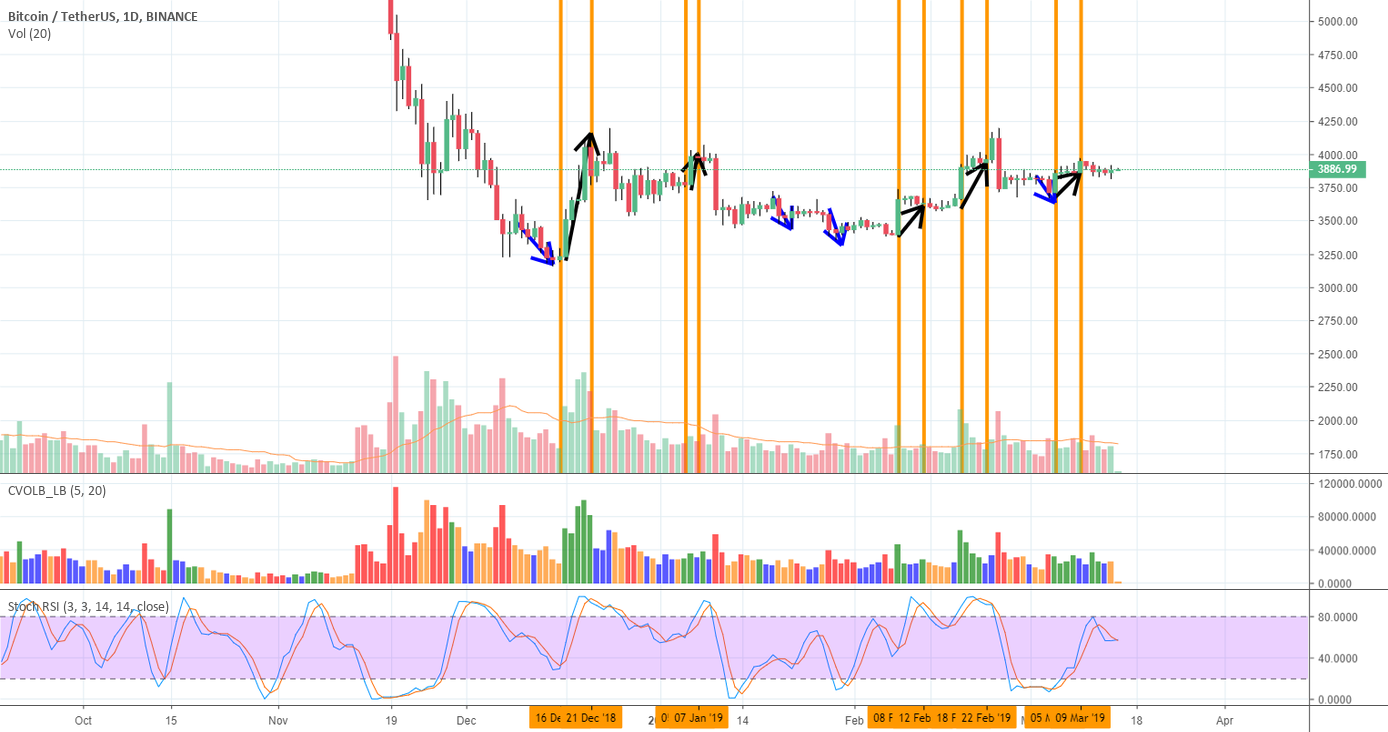
Today, i will tell you some of my secret strategies for trading . When I trade , I use this indicator called Colored Bars by lazybear.
The the colors are determined:
– If today’s closing price and are greater than ‘n’ days ago, color today’s bar green.
– If today’s closing price is greater than ‘n’ days ago but is not, color today’s bar blue.
– Similarly, if today’s closing price and is less than ‘n’ days ago, color today’s bar orange.
– If today’s closing price is less than ‘n’ days ago but is not, color today’s bar red.
The strategy is to buy green and sell when it turns the color. I only use this for entry and exit confirmation, but you can see from the chart that every time I follow this strategy, I can get sizable profit 🙂 The default lookback period is set to be 10, but I change this number to 5 for daily. (6 for 4 hourly)
Today, we just see blue bar turned into orange/red. If you see from chart, majority of the time blue bar turn into orange/red bar, we saw some significant down trend (blue arrows), and I am just wondering if this is the first warning for the upcoming dump. It seems like is starting to curl up, but if we have dump today, this can easily curl downward again. Today’s candle will be very important for the direction in next 4-5 days.
Published at Fri, 15 Mar 2019 03:02:58 +0000

