November 2, 2026

Capitalizations Index – B ∞/21M

Heavy Borrowers and Near-Failed States Likely to Drive Hyperbitcoinization

Heavy borrowers and near-failed states likely to drive hyperbitcoinization

Heavy Borrowers and Near-Failed States Likely to Drive Hyperbitcoinization

Heavy borrowers and near-failed states likely to drive hyperbitcoinization

A CIA World Factbook entry listing nations’ current account balances shows that big economies and near-failed states share something in common – massive debt. This liability making them strong cases for hyperbitcoinization, which could be exacerbated by an anticipated global economic slowdown.

Also read: Governmental Overreach in Developing Nations Will Hasten Hyperbitcoinization

 Debt-Ridden Economies Prime Cases for Hyperbitcoinization

Hyberbitcoinization theorists have little faith in the fiat establishment. They believe that state authorities, who control national currencies, will erode them to a point where citizens will be forced to ditch them for bitcoin, resulting in entire countries being powered by peer-to-peer decentralized currency.

The hyperbitcoinization theory (H-theory), published by Daniel Krawisz of the Satoshi Nakamoto Institute in 2004, predicts that bitcoin will lead to demonetization of currencies that will lose value, as people settle for bitcoin as a superior option. bitcoin will be attractive as it is not subject to capital controls, maintains value as fiat currencies erode, and is an inclusive financial instrument into other economies.

Heavy borrowers and near-failed states likely to drive hyperbitcoinization

Though purely numeric, the CIA list, running up to 2017, details governments’ long-standing habits, from the heavy-borrowing, war-like giants at the bottom, to struggling ones in the middle and disciplined spenders at the top. “Current account balance compares a country’s net trade in goods and services, plus net earnings, and net transfers to and from the rest of the world during the period specified,” the agency explains in regards to the criterion of the list, which is calculated on an exchange rate basis.

The U.S. sits at the bottom of the intelligence agency’s list with a negative balance of -$466.2 billion, just beneath the U.K which is also wallowing in borrowed affluence with a balance of -$106.7 billion. India, Canada, Turkey, France and Australia make up the bottom eight with 11-digit negative balances.

Citizens commonly bank on their authorities to painlessly manage debt and forestall dramatic ripples in their own lifestyles. Governments, in turn, are given to their habits, from shoring up geopolitical hegemony and staging spectacles in endless wars, to printing money for bloated civil service payrolls and punishing the poorest citizens with austerity when the day of reckoning arrives.

Fiat Currency Overlords Leave Citizens Poorer

Since Jack Ma criticized the U.S. for blowing its fortune on war at Davos, the country has failed to sizeably reduce its military footprint and in fact gotten closer to confrontation with military giants like Russia, China and North Korea, with potential proxy battle zones like Venezuela emerging. The national debt incurred by the military-industrial complex is ultimately spread across households, with taxpayers on the hook for trillions of dollars of spending.

The U.S. is also notoriously oil-intensive, with 50 percent of its consumption going to oil imports. The value of the dollar is, therefore, tied to oil prices, and has depreciated as oil prices doubled between 2001 and 2006 and then went up 50 percent between 2006 and 2008, affecting domestic households through reduced purchase power. There is an upside to this however in that America’s status as one of the world’s most technologically advanced nations would work in its favor in the event of hyperbitcoinization occurring.

Heavy borrowers and near-failed states likely to drive hyperbitcoinization

In countries like North Korea, military might takes primacy over the economic wellbeing of citizens. Countries like Zimbabwe are not known aggressors but military spending helps insulate the regime from economic discontent. Citizens have experienced central bank heists in two decades in which their savings were substantially eroded by questionable monetary policies.

In Venezuela, where a humanitarian breakdown is now coupled with political confrontation, citizens have resorted to bitcoin to keep their heads above the chaos. Zimbabwe has been slower to transition to bitcoin, but the perennial erosion of the currency is a strong case for cryptocurrency and an increasing number of students are redirecting.

Hyperbitcoinization in oil-rich Venezuela would be driven by cheap electricity which makes bitcoin mining ideal. The more affluent states on the list, particularly the U.K, are advanced in technology, making the penetration of cryptocurrency easier, whereas their counterparts in the global south will be affected by the divide. Some rural populations in the southern hemisphere lack reliable electricity and internet connectivity, placing crypto transactions out of reach.

Hyperbitcoinization is a dystopian bet. Having nurtured the infrastructure required to disrupt fiat hegemony, bitcoin visionaries are waiting for state actors to torch their own world and drive citizens to cryptocurrency. Unlike fiat currencies which can be inflated from reserve bank printing presses, there is a finite amount of bitcoin that can ever enter circulation. Safe from capricious state authorities and free from central control, it is emergency money, on standby for any nation whose people need it.

What do you think about the concept of hyperbitcoinization and which countries are mostly likely to be affected by such an event? Let us know in the comments section  below.


Images courtesy of Shutterstock.


Express yourself freely at bitcoin.com’s user forums. We don’t censor on political grounds. Check forum.bitcoin.com

The post Heavy Borrowers and Near-Failed States Likely to Drive Hyperbitcoinization appeared first on Bitcoin News.

source: https://news.bitcoin.com/heavy-borrowers-and-near-failed-states-likely-to-drive-hyperbitcoinization/

Published at Sun, 10 Feb 2019 16:30:49 +0000

Previous Article

Twitter CEO on Bitcoin “The Internet Will Have a Currency” | Joe Rogan

Next Article

Bitcoin : Bullish Gartley Lift Off! Litecoin +24%! Episode 334 – Cryptocurrency Technical Analysis

You might be interested in …

Bitcoin Price Analysis: Post-Fork Exuberance Shows No Signs of Pulling Back (Yet)

Bitcoin Price Analysis

Remember that time I said BTC-USD likely won’t see a new all time high (ATH) any time soon? Looks like I was wrong. Shortly after posting my previous BTC-USD analysis, in a matter of one hour, the price of BTC-USD not only broke its record high, but it surpassed it by $200 after ultimately settling in the $3200s. As of this morning, BTC-USD pushed another ATH of $3440 on Bitfinex marking a $600+ in less than a week. Let’s take a look at what these moves can possibly mean for BTC-USD and if these moves are sustainable.

Starting in the $160s, BTC-USD has been on a massive, multi-year bull run:

Figure_1 (3).JPGFigure 1: BTC-USD, 3 Day Candles, Bitfinex, Macro Bull Trend
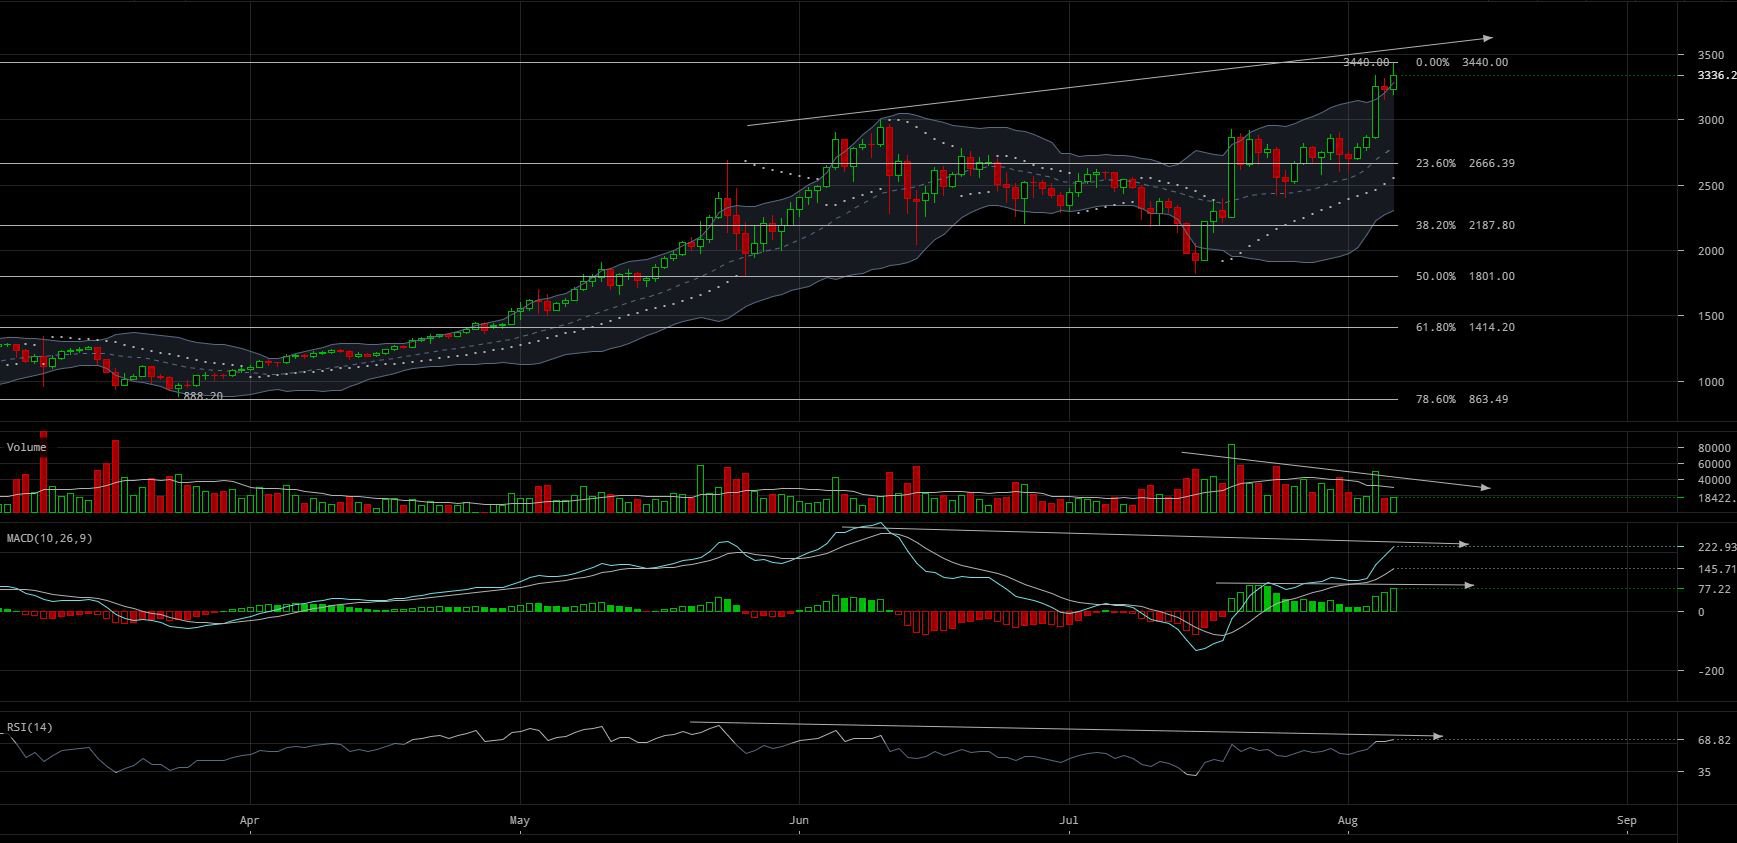
If we plot the trend using $3440 as the top of this trend, a lot of historic support and resistance levels start to make a lot more sense within the context of the market. Our move to the $1800s marked a test of the 50% retracement line, our battle over the $2600s marked the various tests of the 23.6% retracement line and now our ultimate sudden rush to new highs can be seen as the 100% retracement line.

Keeping the same Fibonacci Retracement Lines and zooming into our daily trend, a few observations immediately pop out:

Figure_2 (3).JPGFigure 2: BTC-USD, 1 Day Candles, Bitfinex, Macro Bull Trend, Zoomed In

  1. There is an obvious price increase on the long-term trend;

  2. Our recent run from $1800, however, has seen decreasing volume on every leg up;

  3. The multi-period MACD and current MACD histogram both show Bearish Divergence; and

  4. The RSI is showing Bearish Divergence.

If we take a closer look to the market post-$1800s, we see a similar trend of divergence even on the smaller timescales:

Figure_3 (4).JPGFigure 3: BTC-USD, 6 Hour Candles, Bitfinex, Current ATH

  1. The uptrend in price is, once again, accompanied on decreasing volume;

  2. The 6HR is strongly diverging bearishly;

  3. The RSI is showing strong bearish divergence; and

  4. The 6HR Bollinger Bands show several candles fully formed outside the upper band (shown in the circle).

For those who are unfamiliar with Bollinger Bands: Simply put, they are a strong tool used to visualize market volatility. Typically, when a market is near the edge of the upper band, it is considered “overbought,” and when it nears the edge of the lower band it is considered “oversold.” When a market punctures a band it will typically yield a pullback to a trend within the bands, and when a candle is completely formed outside the bands it is usually a strong sell or buy signal — a sell signal in our case. You can think of the Bollinger Bands like a set of rubber bands: the tighter you stretch a rubber band, the harder the reaction. Typically, this is the case for markets that puncture the bands and especially for those that fully form candles outside the bands.

Looking at our current Bollinger Band trend, one might be tempted to say, “BTC-USD appears to be pulling back within the 6-Hour Bands — looks like a healthy move upward is still in the cards.” However, if we zoom out and look back through the history of BTC-USD and its interaction with the 1-Day Bollinger Bands, we can see a clear market trend.

Figure_4.JPGFigure 4: BTC-USD, 1 Day Candles, Bitfinex, Bollinger Band Trend

Above are several historic examples of BTC-USDs reaction to a puncturing of the 1-Day Bollinger Bands. More often than not, a puncturing of the bands — whether the lower or upper band — is greeted with a market pullback. The stronger the break of the bands, the stronger the pullback. The strongest breaks of the bands have a very strong tendency to return to the middle line of the Bollinger Bands (the dashed line) before continuing its trend up or down.

If there is so much damning evidence of a pullback, why does the price keep rising? Fear of Missing Out (FOMO) is unpredictable and irrational. FOMO can push markets well beyond what Technical Analysis can predict and often defies market indicator signals. With all the hype surrounding the recent hard fork, and the influx of money coming from people cashing out their bitcoin Cash where does this leave us? There is a mountain of evidence suggesting this market level is unhealthy and highly overextended; it needs either to consolidate considerably or retrace. BTC-USD is tightly wound and there is very little, if any, sign of health within its most recent market moves.

I’m not saying the market won’t continue to the pump even higher than it is currently — Goldman Sachs has a price target of $3600, after all. However, with each hike in the BTC-USD price, we are increasing the likelihood of a strong pullback and ultimately a return to the center of the Bollinger Bands.

Summary:

  1. On all relevant timescales, BTC-USD is showing strong signs of an overextended market.

  2. The Bollinger Bands have several candles fully formed outside the upper bands on the 6 HR, 12 HR and 1 Day Candles.

  3. Historically, when the 1 Day Bollinger Bands are punctured, there is a market pullback.

Trading and investing in digital assets like bitcoin, bitcoin cash and ether is highly speculative and comes with many risks. This analysis is for informational purposes and should not be considered investment advice. Statements and financial information on bitcoin Magazine and BTC Media related sites do not necessarily reflect the opinion of BTC Media and should not be construed as an endorsement or recommendation to buy, sell or hold. Past performance is not necessarily indicative of future results.

The post Bitcoin Price Analysis: Post-Fork Exuberance Shows No Signs of Pulling Back (Yet) appeared first on Bitcoin Magazine.

Inflationcoin - пос-монета с 80% доходом. Iflt

InflationCoin – пос-монета с 80% доходом. IFLT

InflationCoin – пос-монета с 80% доходом. IFLT http://inflationcoin.org – сайт https://www.coingecko.com/en/coins/inflationcoin – обзор IFLT https://coinmarketcap.com/currencies/inflationcoin/ https://bitcointalk.org/index.php?topic=1710214.0 – форум https://github.com/inflationcoin/inflationcoin – гитхаб https://www.investing.com/crypto/inflationcoin/iflt-usd-technical https://www.reddit.com/r/Inflationcoin/ https://t.me/InflationCoin https://bitebtc.com/ Ссылка на биржу https://yobit.net/en/trade/IFLT/DOGE Ссылка на биржу https://www.cryptopia.co.nz/Exchange?market=IFLT_LTC Ноды (их […]