October 13, 2026

Capitalizations Index – B ∞/21M

Everyone Else Is Selling Stocks, So Is It Time To Buy?

Everyone else is selling stocks, so is it time to buy?

Everyone Else Is Selling Stocks, So Is It Time To Buy?

After a difficult few trading days in the beginning of the year, U.S. stocks are bouncing back with meaningful gains on Monday following Friday’s strong rally. The S&P 500, Dow Jones Industrial Average and Nasdaq 100 were all up by more than half a percent by midday. It looks like investors could be taking advantage of the end-of-the-year declines, but is this a wise time to be buying?

Trying to time the bottom of the market will almost always be a fool’s errand, but one firm suggests equities could have much farther to fall before they hit bottom in 2019.

Get The Full Series in PDF

Get the entire 10-part series on Charlie Munger in PDF. Save it to your desktop, read it on your tablet, or email to your colleagues.

Q3 hedge fund letters, conference, scoops etc

2018 is in the books

In their “Flow Show” report last week, Bank of America Merrill Lynch Chief Investment Strategist Michael Hartnett and team suggested that it is time to buy, but stocks probably aren’t yet at the “Big Low of ’19.” They calculated flows for each major asset. The U.S. dollar was up 4.4%, while cash was up 1.9%. Bonds were down 1.2%, equities fell 8.7% and commodities declined 13.1%.

They also said 2018 was the first year cash has outperformed both bonds and stocks since 2000. With a dramatic flourish, they described the stock market in 2018 as “Apocalypse Dow” filled with “horror” since the “Big Top of Jan’ 18.”

All that drama seems warranted since the global equity market has shed $19.9 trillion in market capitalization from peak to trough. They also said 2,055 of the 2,767 U.S. and global companies were officially in a bear market, and the world’s banks were pricing similar to the low levels observed in 2008.

Selling stocks, time to buy extreme bear

“Extreme bear” reading…

With all those declines, the BofAML Bull & Bear Indicator fell to 1.8, which Hartnett and team describe as an “extreme bear” reading. They also said their indicator has now triggered the first buy signal for risk assets since June 2016 when Brexit was hanging over the world’s markets.

Exactly one year ago, their Bull & Bear Indicator triggered a sell signal, they added.

Selling stocks, time to buy

But not the “Big Low of ’19”

Even though the BofAML team says a buy signal has been triggered, they do believe stocks have further to fall before they reach the “Big Low of ’19.” In fact, they think the building blocks of this low point they’re predicting are now falling into place. They believe two things still have yet to fall into place.

The first is a trough for profit expectations, which they believe remain too high for stocks to be at their bottom.

Selling stocks, time to buy

The second is policy panic, which could take the form of the Fed slashing rates to prevent a credit event.

Selling stocks, time to buy

Flow capitulations

The BofAML team also said equities set new records for outflows over the last six weeks, reaching $84 billion. Other sources have said they don’t believe U.S. stocks have reached full capitulation yet.

Selling stocks, time to buy

Outflows in investment-grade bonds also set a new record at $34 billion. Meanwhile investors were shifted to less-risky assets, especially government bonds. Inflows to government bonds reached a record high of $24 billion over the last six weeks.

Selling stocks, time to buy

BofAML also observed inflows of $1.8 billion into gold, $12.7 billion out of bonds, and $30.2 billion out of equities over the previous two weeks.

They also noted strong capitulation among their firm’s wealth management clients. Asset allocations to equities fell to 57.3%, which was the lowest level since February 2016.

Selling stocks, time to buy

Cash allocations were at 12.1%, which was the highest level since March 2016, and debt allocation stood at 24.5%.

Selling stocks, time to buy

Where to next?

The BofAML team predicted that the S&P will bounce from 2,450 on Jan. 4 to 2,650. As of midday on Monday, the index is already halfway there at around 2,550. By the end of the year, Bloomberg sees the S&P at 2,975.

This month they see the most upside in Chinese and German equities, U.S. small caps, semiconductors, energy stocks, U.S. and Euro high-yield bonds and emerging market currencies. They describe all of these assets as “very oversold.”

On the other hand, they expect Treasuries, the yen, and healthcare and utility stocks to underperform this month. They also pointed out that the Utility index’s 52-week outperformance of the S&P was close to the extremes it touched in 2001 and 2008.

This article first appeared on ValueWalk Premium

The post Everyone Else Is Selling Stocks, So Is It Time To Buy? appeared first on ValueWalk.

Published at Mon, 21 Jan 2019 03:03:51 +0000

Previous Article

Dogecoin / Bitcoin [BTC] (DOGE/BTC): Supports, Pivots & Resistances

Next Article

Develop a Successful FinTech Startup Business Today! Manchester – Finance – Entrepreneur – Workshop – Hackathon – Bootcamp – Virtual Class – Seminar – Training – Lecture – Webinar – Conference – Course

You might be interested in …

Bitcoin Core 0.17.1 Released

bitcoin Core 0.17.1 Released bitcoin Core version 0.17.1 is now available for download containing several bug fixes and minor improvements. For a complete list of changes, please see the release notes. If have any questions, […]

Bitcoin Price Analysis: BTC Pushes All-time Highs and Tests Historic Resistance

Bitcoin Price Analysis

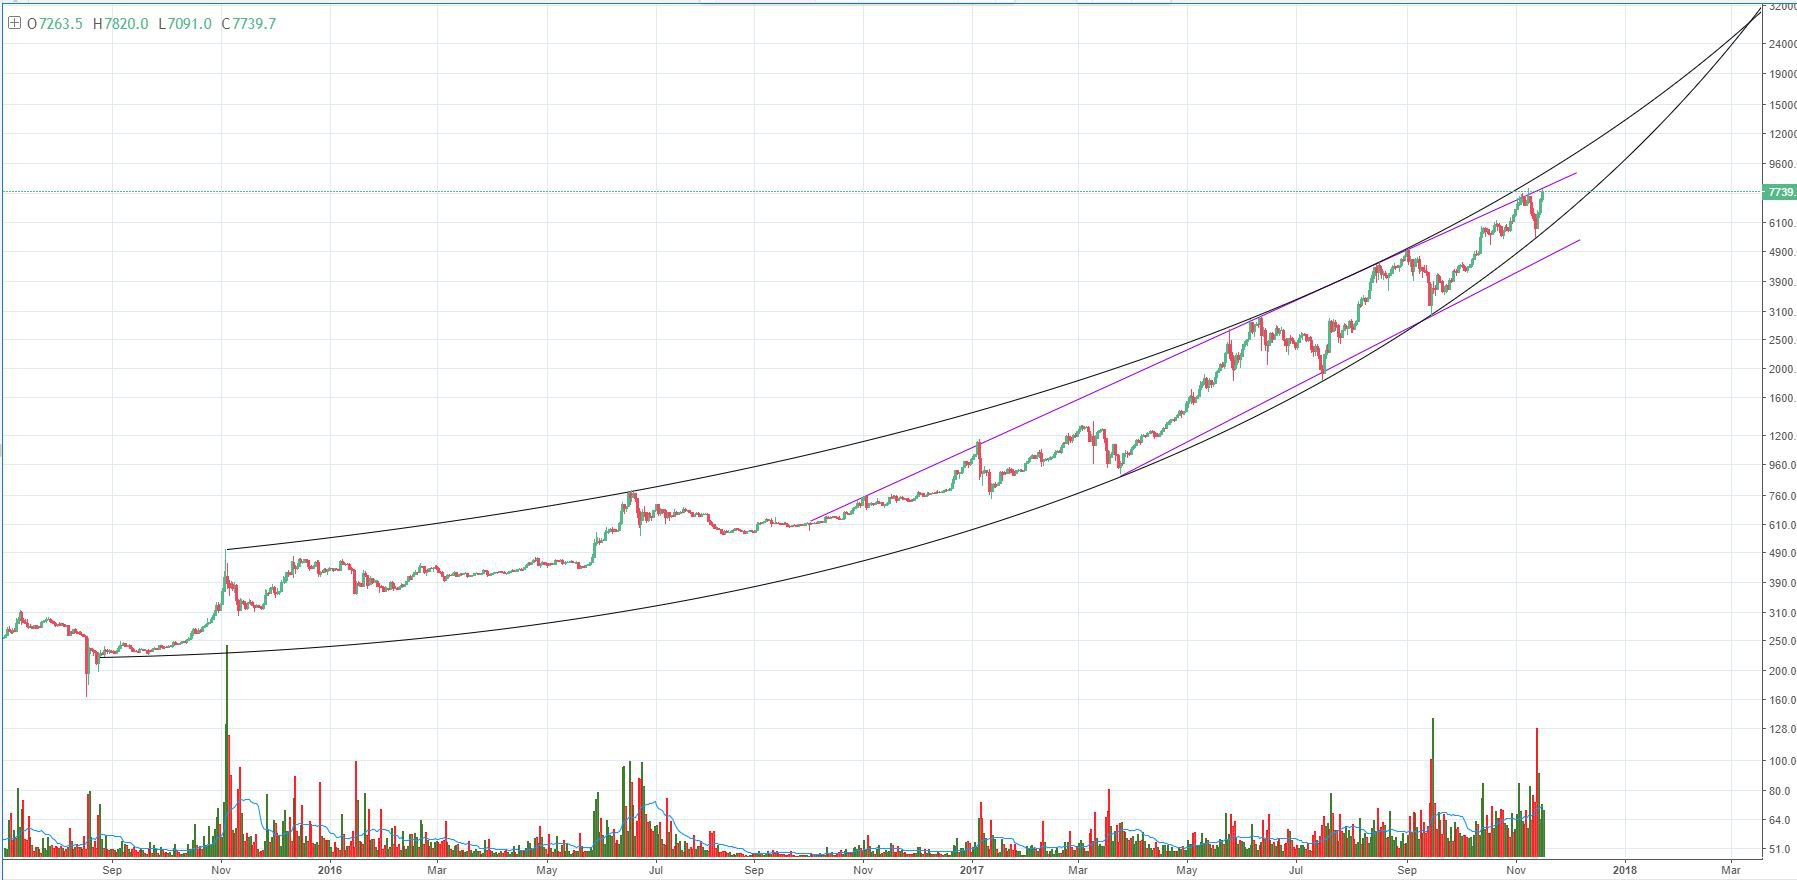
Throughout the life of bitcoin’s two-year bull run, it has been confined within two macro trends: one parabolic and one linear — both on a logarithmic scale:

Figure_1.JPGFigure 1: BTC-USD, 1-Day Candles, Macro Trend

The parabolic envelope (black curves) has confined the entire bull run throughout the last two years. Over the weekend, we saw a test of the lower curve that proved to be proper support and propelled the market into a bounce that now has the market testing the upper linear trendline (purple lines) at the time of this article:
Figure_2.JPGFigure 2: BTC-USD, 2-Hour Candles, Test of Upper Trendline

As the bitcoin market approaches the upper trendline, the price action will coincide with a test of the previous all-time high. Expect this to be a point of resistance with possible market turbulence. However, if we manage to break that resistance level and hold support above the trendline, there is no clear resistance until we test the parabolic envelope in the upper $8,000s.

If we look at the macro indicators for this move, we see some signs that have proven to be indications of short-term rallies leading to corrections:

Figure_3.JPGFigure 3: BTC-USD, 1-Day Candles, Bollinger Band Trend

The last two corrections bitcoin has seen came on the tail of a minor pullback that rebounded to a new all-time high. The one-day candle trend is, so far, showing a repeated pattern that has led into a reversal each time it tested the upper parabolic curve. A rounding of the Bollinger bands during an upward move (shown in purple) is a forecast for decreased upward volatility that will lead to either a consolidation period or a reversal to the lower Bollinger bands.

While a reversal is not required of this move upward, one can speculate that once the price tags the upper parabolic curve, we could see a pullback to the lower Bollinger bands on the one-day charts. A pullback to the lower Bollinger bands would see support quite nicely with the lower parabolic curve.

One of two outcomes can be expected from this move upward: either we will test the upper parabolic trendline and reverse, or we will break above and consolidate before continuing on a very strong bullish move to new highs.

However, these macro moves have become increasingly more demanding on the market as we continue to get squeezed within the parabolic envelope. The forecast of the Bollinger bands indicates we are not likely to see a sustained move higher without a consolidation period or a pullback.

Summary:

  1. Over the weekend, bitcoin saw another test of the lower parabolic curve that proved to be strong support.

  2. After testing the parabolic curve, the market rebounded and has now established a new all-time high.

  3. If this trend continues, bitcoin could see prices in the mid to upper $8,000s before any noticeable resistance stands in the way of the price growth.

Trading and investing in digital assets like bitcoin and ether is highly speculative and comes with many risks. This analysis is for informational purposes and should not be considered investment advice. Statements and financial information on bitcoin Magazine and BTC Media related sites do not necessarily reflect the opinion of BTC Media and should not be construed as an endorsement or recommendation to buy, sell or hold. Past performance is not necessarily indicative of future results.

The post Bitcoin Price Analysis: BTC Pushes All-time Highs and Tests Historic Resistance appeared first on Bitcoin Magazine.