- ETH price started a major consolidation after a nasty upward move above $120 against the US Dollar.
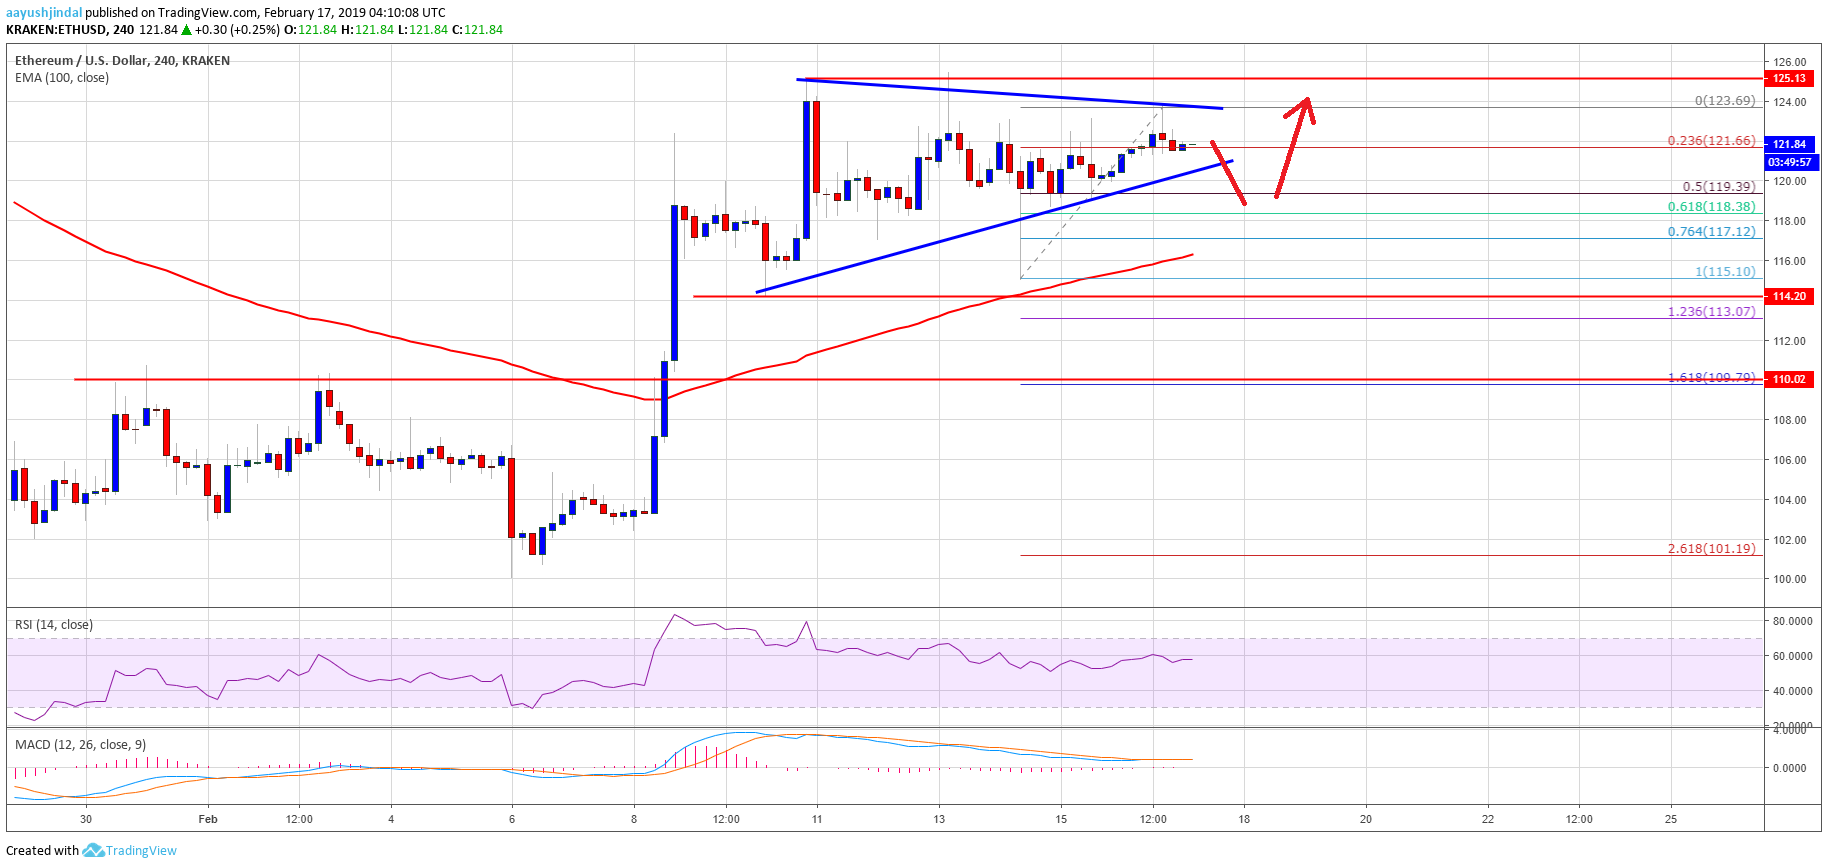
- There is a contracting triangle in place with resistance at $124 on the 4-hours chart of ETH/USD (data feed via Kraken).
- The pair is likely to accelerate higher once it breaks the $124 and $125 resistance levels in the near term.
- On the other hand, a break below $119 might call for more declines towards the $114 or $110 level.
price is placed nicely in a positive zone versus the US Dollar and . ETH/USD could soon make the next move either above $125 or below the $119 support.
Ethereum Price Analysis
This past week, there was a above the $120 resistance in ETH price against the US Dollar. The ETH/USD pair traded towards the $125 area, where sellers emerged. Later, the price started a major consolidation pattern below the $125 zone. During the consolidation, there were a few attempts to clear the $125 resistance, but buyers failed. Besides, there were bearish waves as well towards the $120 level. The last swing low was formed at $115 and the last swing high was near $124. The price is currently near the $122 level and well above the 100 simple moving average (4-hours).
The 23.6% Fib retracement level of the last wave from the $115 low to $124 high is near the $122 level to act as a support. It seems like there is a contracting triangle in place with resistance at $124 on the 4-hours chart of ETH/USD. If there is an upside break above the triangle resistance and $125, there are chances of a solid upside continuation. The next resistance above $125 is near the $128 and $130 levels. The main resistance is at $134, where sellers are likely to appear.
On the other hand, if there is a below the $120 and $119 supports, there could be more losses. The next key support is at $118 and the 61.8% Fib retracement level of the last wave from the $115 low to $124 high. Below $118, the price could test $116 and the 100 simple moving average (4-hours).
The above indicates that ETH price is likely preparing for the next key break either above $124 or below $119 in the near term. Even if there is a downside break, the price remains supported above $115.
Technical Indicators
4 hours MACD – The MACD for ETH/USD is about to move back in the bullish zone.
4 hours RSI – The RSI for ETH/USD is currently well above the 50 level.
Major Support Level – $115
Major Resistance Level – $125
Published at Sun, 17 Feb 2019 05:00:23 +0000