Key Highlights
- ETH price remained in a solid uptrend and it could trade above $170 and $180 against the US Dollar.
- There is a crucial bullish trend line formed with support at $148 on the 4-hours chart of ETH/USD (data feed via Kraken).
- The pair could resume its upward move and it may soon clear the $162 and $170 resistances.
price is slowly gaining momentum versus the US Dollar and . ETH/USD may correct lower in the short term, but dips remain supported.
Ethereum Price Analysis
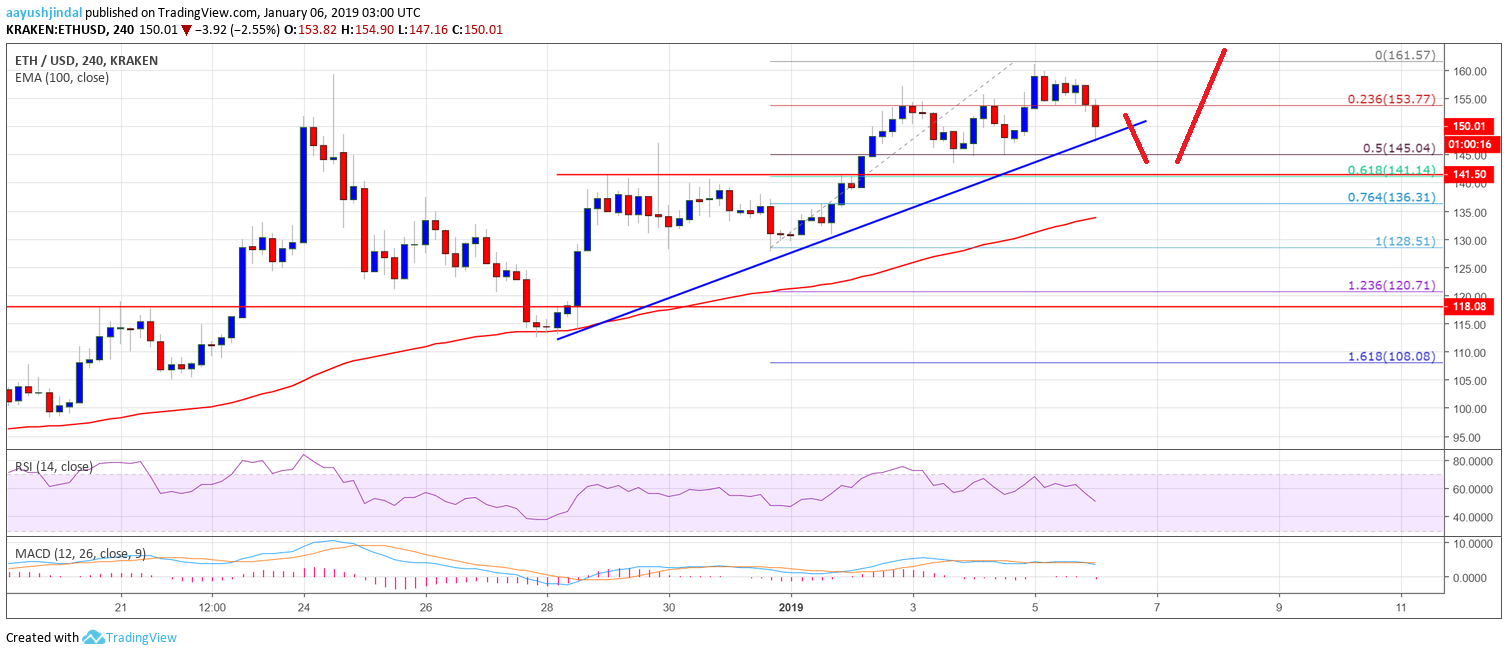
This past week, ETH price followed a above the $120 pivot area against the US Dollar. The ETH/USD pair broke the $142 resistance area and settled above the 100 simple moving average (4-hours). Later, buyers gained bullish momentum and broke the $150 and $154 resistance levels. The price even broke the $160 level and traded towards the $162 level.
A high was formed at $161.57 and later the price started a downside correction. It declined below the $154 support to move into a short term bearish zone. Sellers pushed the price below the 23.6% Fib retracement level of the recent wave from the $128 low to $162 swing high. However, there are many supports on the downside near the $150 and $142 levels. Moreover, there is a crucial bullish trend line formed with support at $148 on the 4-hours chart of ETH/USD. Below the trend line, the 50% Fib retracement level of the recent wave from the $128 low to $162 swing high is at $145. Therefore, downsides near the $150 and $145 levels are likely to find a .
The above indicates that ETH price remains in a decent uptrend above the $142 support. On the upside, a break above the $162 swing high may open the doors for $170 and $180.
4-hours MACD – The MACD is slightly placed in the bearish zone.
4-hours RSI – The RSI is moving lower towards the 50 level.
Major Support Level – $142
Major Resistance Level – $162
Published at Sun, 06 Jan 2019 04:43:31 +0000