Key Highlights
- ETH price declined sharply and broke the $460 and $450 support levels against the US Dollar.
- There is a major bearish trend line forming with resistance at $455 on the hourly chart of ETH/USD (data feed via Kraken).
- The pair may correct higher in the short term, but upsides are likely to be capped by $455 and $475.
Ethereum price has moved into a bearish zone against the US Dollar and bitcoin. ETH/USD may continue to decline as long as it is below $490.
Ethereum Price Bearish Trend
It is turning out to be a since ETH price is now trading well below $500 against the US Dollar. The price was not able to correct higher and remained in a bearish trend below $500. It broke many supports such as $475, $460 and $450. It is now trading well below the $500 level and the 100 hourly simple moving average.
The recent low was at $438.76 from where there could be a minor upside correction. An initial resistance is around the 23.6% Fib retracement level of the last decline from the $535 high to $438 low. Moreover, there is also a major bearish trend line forming with resistance at $455 on the hourly chart of ETH/USD. If there is a break above the $460 resistance zone, the price may head towards the $485-490 area. The 50% Fib retracement level of the last decline from the $535 high to $438 low is also positioned near $485 to act as a .
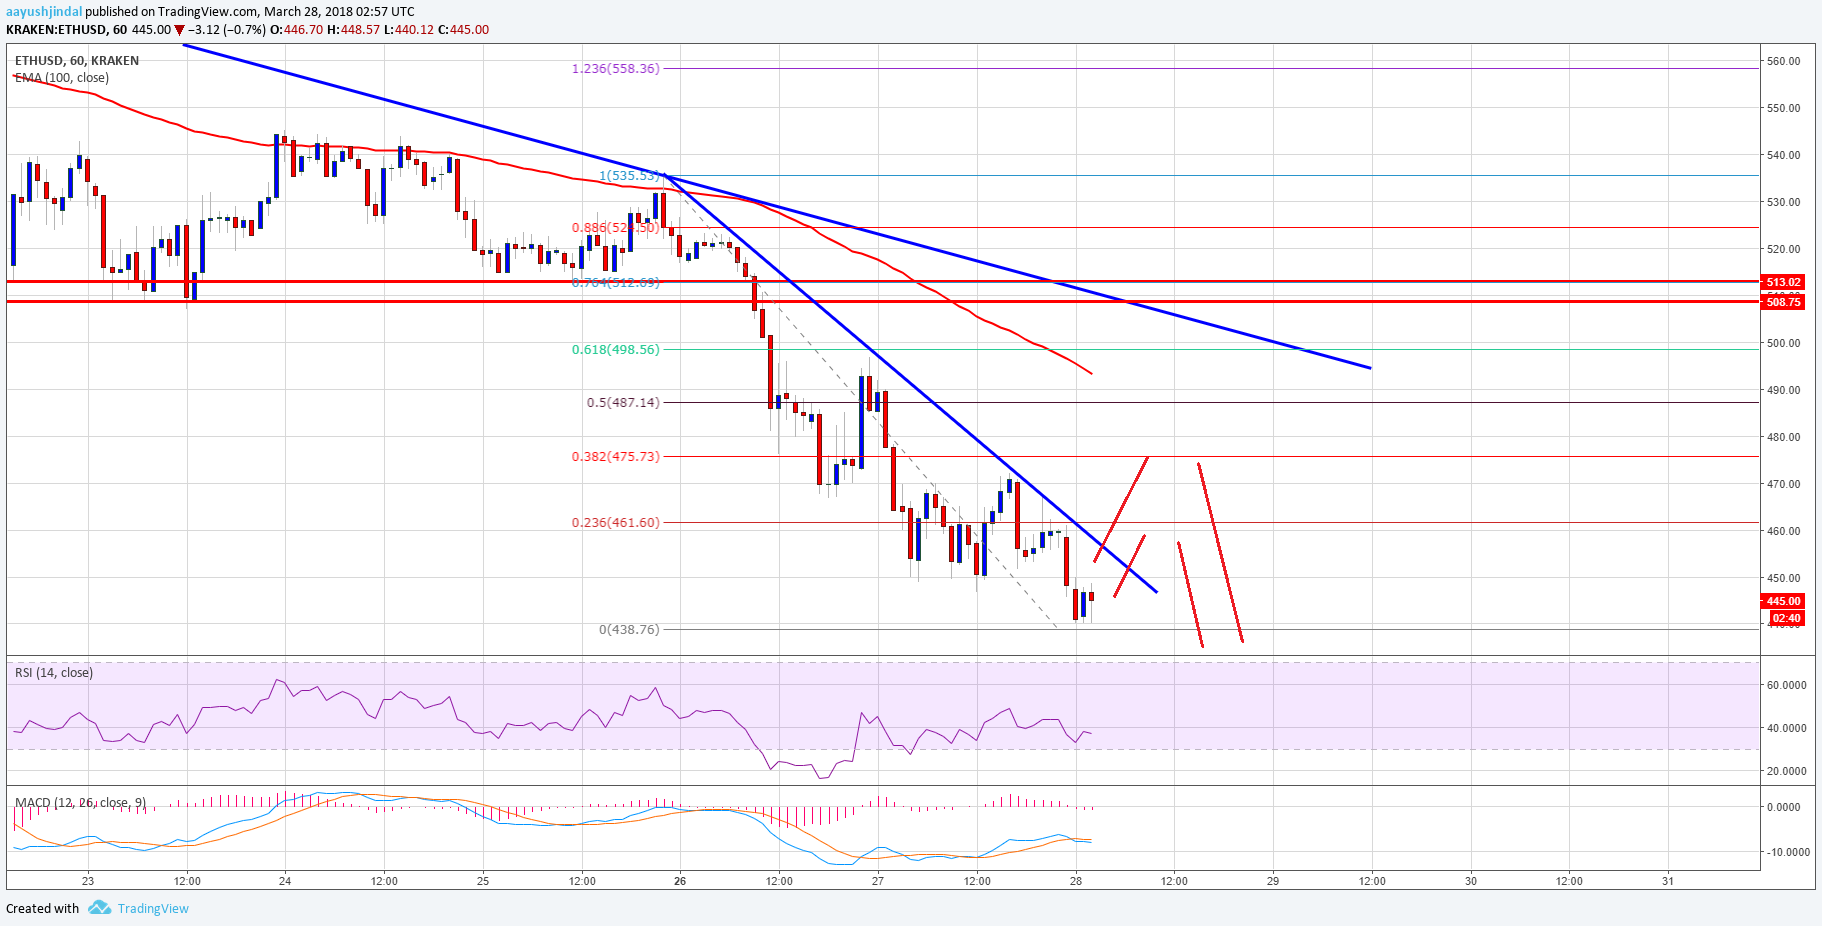
On the downside, the price may soon break the recent low of $438. The next support could be around the $425 level. However, if ETH sellers remain in action for a long time, the price may even test the $400 level in the near term.
Hourly MACD – The MACD is placed nicely in the bearish zone.
Hourly RSI – The RSI is currently rising from the 35 level.
Major Support Level – $425
Major Resistance Level – $485
Charts courtesy –
Published at Wed, 28 Mar 2018 05:00:33 +0000
Analysis