Key Highlights
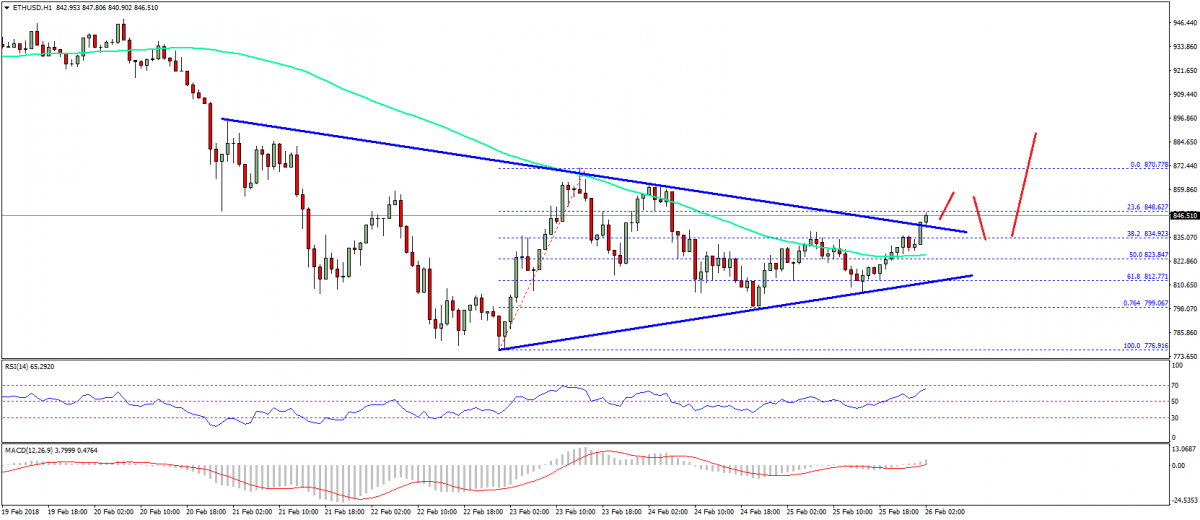
- ETH price recently corrected lower and found support around the $800-810 area against the US Dollar.
- The ETH/USD pair is currently attempting an upside break above a bearish trend line at $840 on the hourly chart (data feed via SimpleFX).
- The pair may continue to trade high as long as it is above the $815 support.
Ethereum price is showing positive signs against the US Dollar and bitcoin. ETH/USD may rise in the near term with resistances on the upside near $870 and $900.
Ethereum Price Upside Move
There was a the $870 resistance in ETH price against the US Dollar. The price started a downside correction and traded below $850. It also declined below the 23.6% Fib retracement level of the last wave from the $775 low to $870 high. More importantly, there was a break below the $840 support and the 100 hourly simple moving average.
However, the downside move was protected by the 800-810 support area. Moreover, the 76.4% Fib retracement level of the last wave from the $775 low to $870 high acted as a support and prevented declines. A fresh upside wave was initiated recently and the price moved above $820. It seems like the ETH/USD pair is currently attempting an above a bearish trend line at $840 on the hourly chart. The pair may close above the $840 resistance and it could attempt a run towards $870. However, a break above the $870 resistance won’t be easy in the near term.
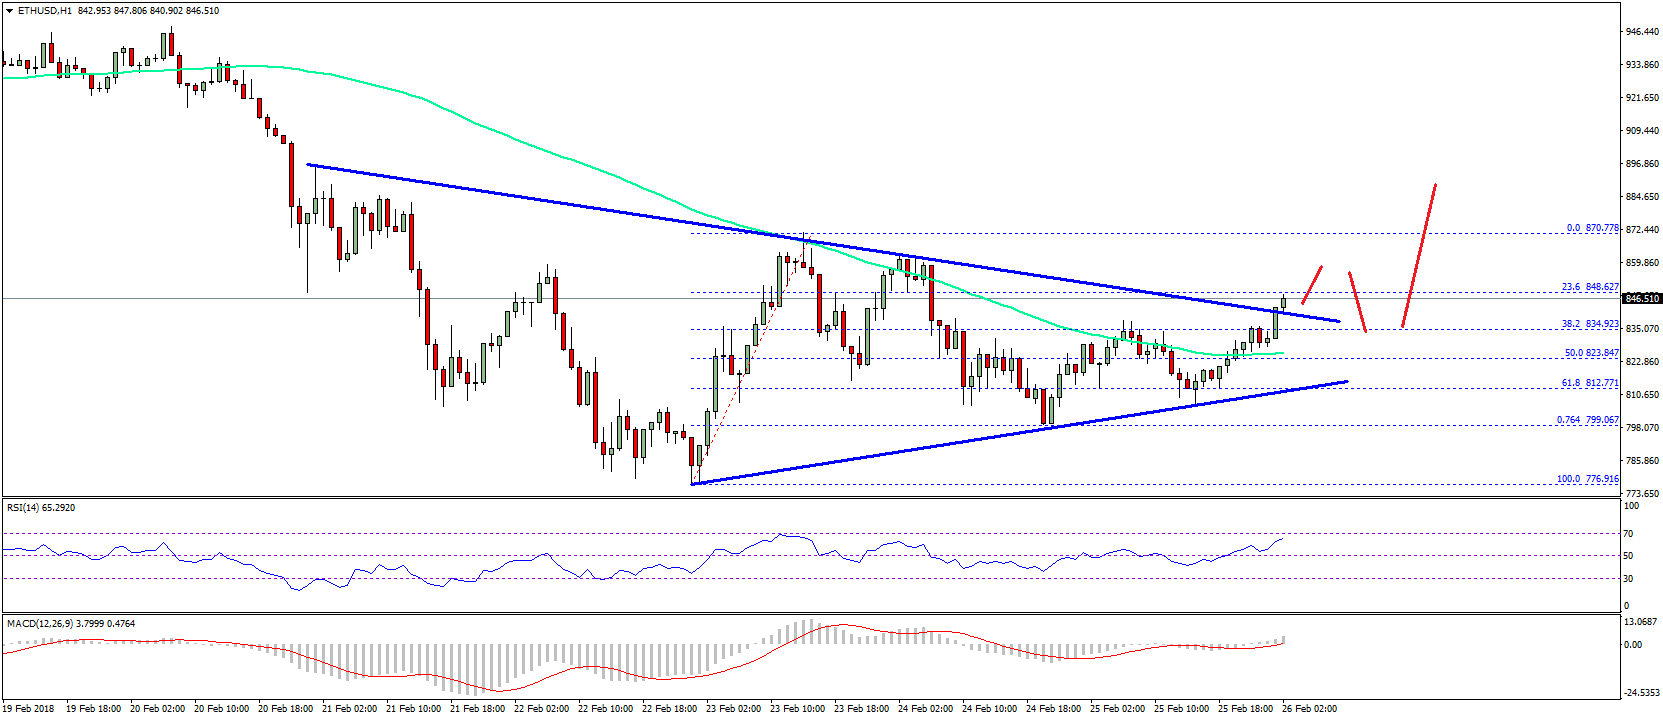
On the downside, the $820 support is a decent buy zone. If the price fails to stay above the $820 support, it could retest the $800 handle. On the upside, a break above the $870 swing high may call for more upsides towards the $900 level.
Hourly MACD – The MACD is now back in the bullish zone.
Hourly RSI – The RSI is currently well above the 50 level.
Major Support Level – $820
Major Resistance Level – $870
Charts courtesy –
Published at Mon, 26 Feb 2018 05:00:01 +0000
Analysis
