Key Highlights
- ETH price extended declines and it recently traded below the $680 support against the US Dollar.
- There is a major connecting bearish trend line forming with resistance at $720 on the hourly chart of ETH/USD (data feed via SimpleFX).
- The pair may not even correct higher and it is likely to extend declines below the $650 level.
Ethereum price declined substantially against the US Dollar and bitcoin. ETH/USD may continue to decline and it could even test the $600 level.
Ethereum Price Bearish Bias
There was for buyers since ETH price failed to move above the $800 level against the US Dollar. The price started a fresh downside wave and tumbled below the $750 and $720 support levels. The decline was such that the price even broke the $680 support level. It seems like the price is under a lot of bearish pressure and it may even break the $650 support.
The recent low formed was at $657 and it looks like the pair may even not correct in the short term. An initial resistance is around the 23.6% Fib retracement level of the last drop from the $783 high to $657 low. There is also a major connecting bearish trend line forming with resistance at $720 on the hourly chart of ETH/USD. The same trend line resistance is near the 50% Fib retracement level of the last drop from the $783 high to $657 low. Therefore, the $720 level is a major resistance for a . Above $720, the price may retest the $750 level.
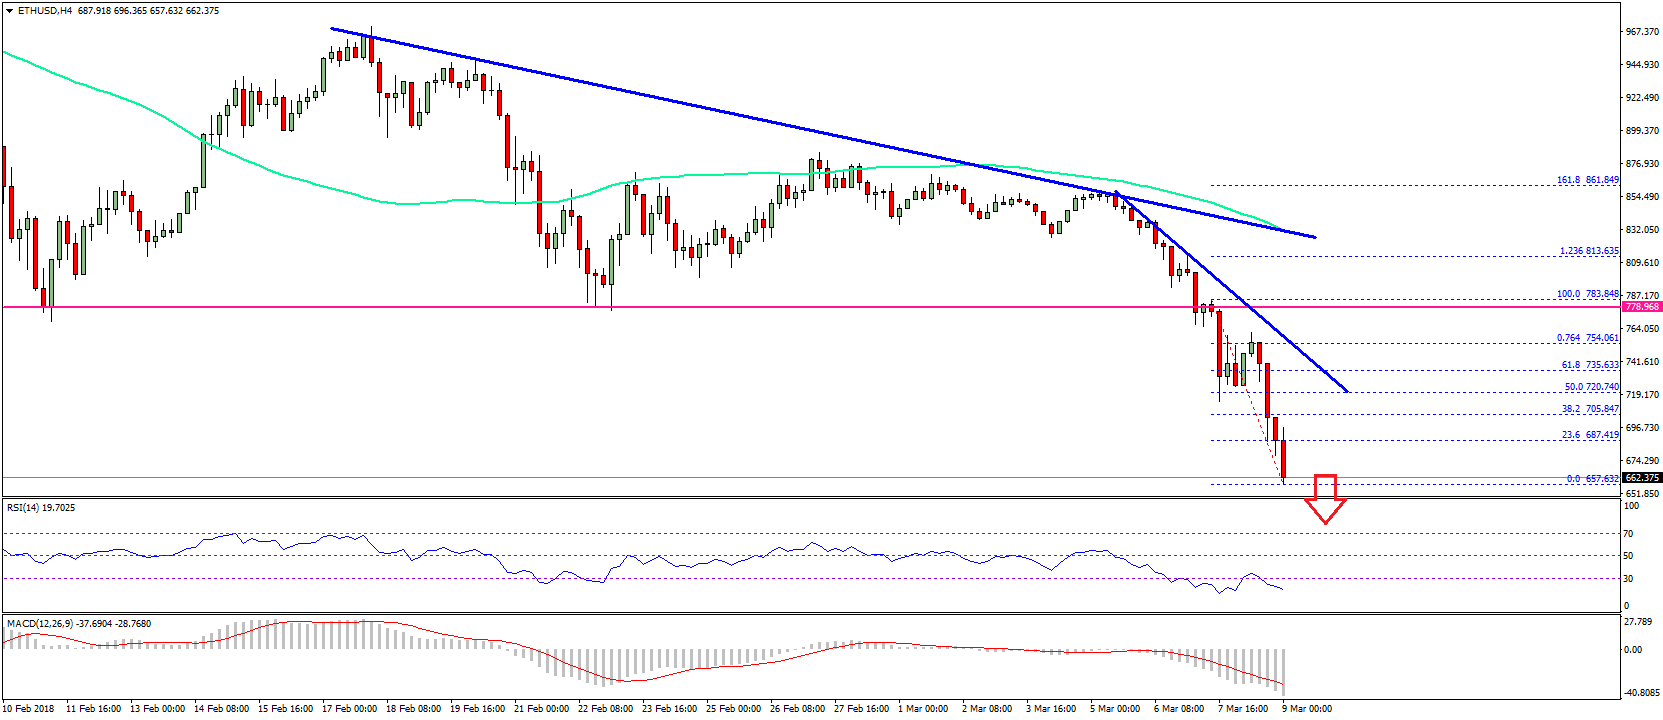
On the downside, the recent low of $657 is a short term support. Below $657, the price could even break the $650 level and trade towards the $600 handle.
Hourly MACD – The MACD is gathering pace rapidly in the bearish zone.
Hourly RSI – The RSI is near the heavy oversold levels with no sign of a recovery.
Major Support Level – $650
Major Resistance Level – $720
Charts courtesy –
Published at Fri, 09 Mar 2018 05:00:24 +0000
Analysis