Key Highlights
- ETH price jumped higher sharply and moved above the $780 resistance level against the US Dollar.
- There is an ascending channel forming with support at $760 on the hourly chart of ETH/USD (data feed via Kraken).
- The pair remains in a solid uptrend, and any downsides are likely to find support around $756 and $746.
Ethereum price surged higher against the US Dollar and bitcoin. ETH/USD moved above the $780 level and it looks set to extend gains in the near term.
Ethereum Price Support
There was a as ETH price moved above the $750 resistance level against the US Dollar. Yesterday, we discussed that the price could move above the $725 level. It not only broke the $725 level, but moved higher by more than $50. During the upside, it broke the $765 and $780 resistance levels, and traded as high as $789.17. At the moment, the price is correcting lower from $789.17, but remains well supported.
ETH price recently traded below the 23.6% Fib retracement level of the last wave from the $714 low to $789 high. However, there are many supports on the downside around the $755 level. More importantly, there is an ascending channel forming with support at $760 on the hourly chart of ETH/USD. Below the channel support, the 38.2% Fib retracement level of the last wave from the $714 low to $789 high may perhaps around $756. Below the stated $756 support, the price could test the next fib support level at $746.
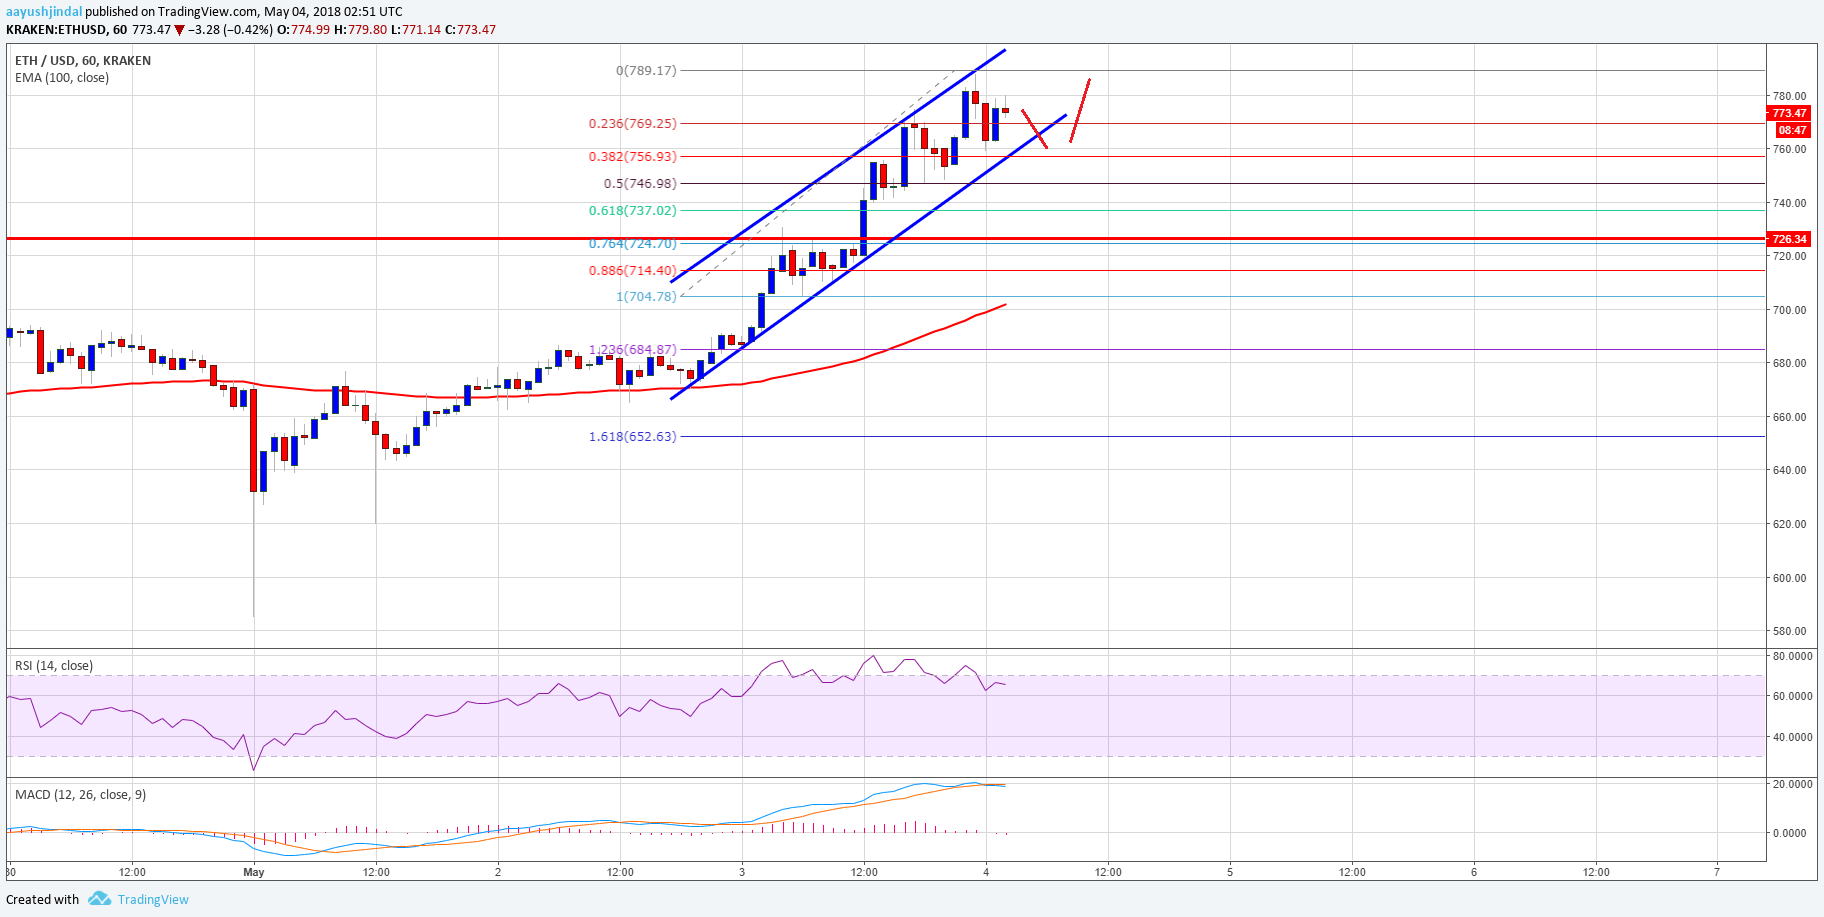
Looking at the , any further declines below $746 could be limited. On the upside, the price is facing a tiny resistance around the $788-790 levels. However, the main hurdle for buyers is close to the $800 level.
Hourly MACD – The MACD is placed nicely in the bullish zone.
Hourly RSI – The RSI is currently correcting lower from the 70 level.
Major Support Level – $756
Major Resistance Level – $790
Published at Fri, 04 May 2018 05:00:49 +0000
Analysis