Key Highlights
- ETH price is moving higher and it recently broke the $535 resistance against the US Dollar.
- There is a new short-term connecting bullish trend line forming with support at $525 on the hourly chart of ETH/USD (data feed via Kraken).
- The pair may continue to rise in the near term towards the $547 and $550 resistance levels.
Ethereum price is gaining upside momentum against the US Dollar and bitcoin. ETH/USD is likely to extend gains with next hurdles near $547, $550 and $575.
Ethereum Price Trend
There was a base formed around the $510 level in ETH price against the US Dollar. The price consolidated for some time before it started an upside move from the $511 swing low. The 100 hourly simple moving average (currently at $508) acted as a major catalyst for an upside move. Buyers succeeded in pushing the price above the $530 resistance area.
There was also a break above the 1.236 fib extension of the last decline from the $524 high to $487 low. The current trend is positive above the $530 level and it seems like the price may continue to rise. Once there is a close above the $535-536 levels, the price could move past $540. The next resistance is at $547, which is the 1.618 fib extension of the last decline from the $524 high to $487 low. If the price corrects lower, the $530 support may act as a buy zone. Moreover, there is a new short-term connecting with support at $525 on the hourly chart of ETH/USD.
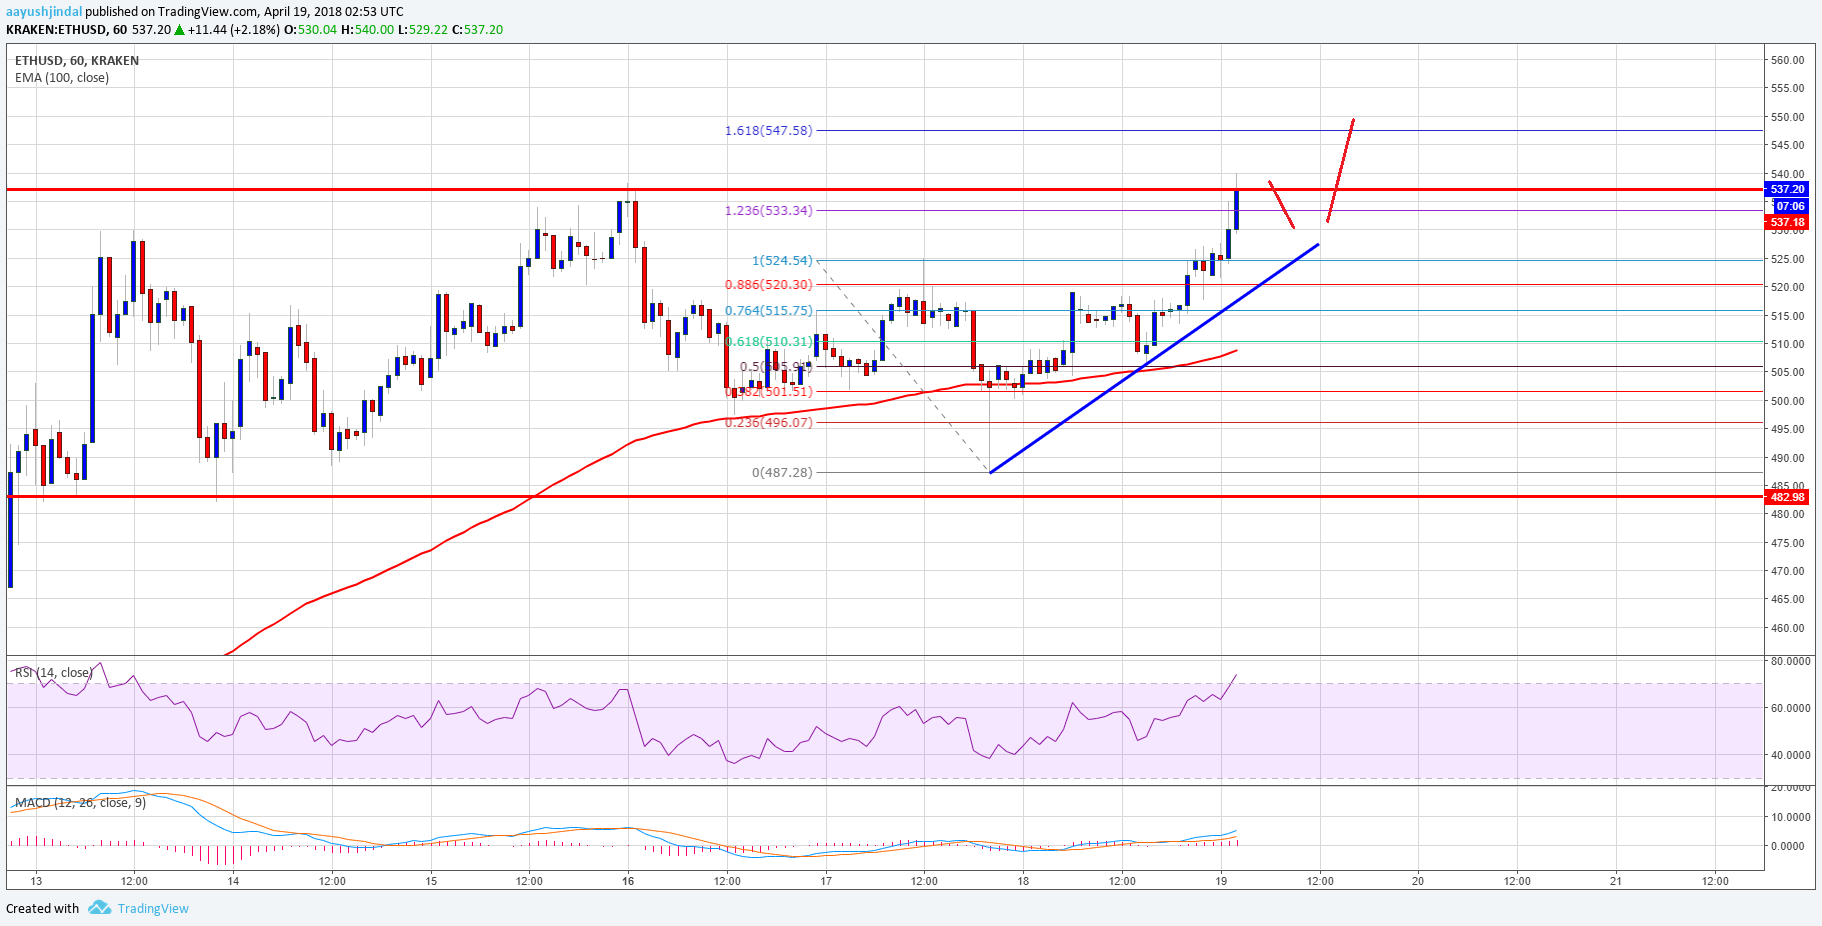
The suggests that the price is gaining momentum above $525. It could continue to rise towards the $550 or even $575 level in the near term. An intermediate resistance is at $560.
Hourly MACD – The MACD is gaining momentum in the bullish zone.
Hourly RSI – The RSI is rising sharply and is currently approaching the overbought levels.
Major Support Level – $502
Major Resistance Level – $524
Published at Thu, 19 Apr 2018 05:00:20 +0000
Analysis