- ETH price failed to climb above the $137 resistance and declined later against the US Dollar.
- The price declined heavily and broke the $134 and $132 support levels.
- Yesterday’s highlighted key bearish trend line is active with resistance at $135 on the hourly chart of ETH/USD (data feed via Kraken).
- The pair is currently correcting higher, but it is likely to face sellers near $134 and $135.
Ethereum price declined sharply below key supports against the US Dollar and . ETH might correct higher, but it is likely to struggle near the $135 resistance area in the near term.
Ethereum Price Analysis
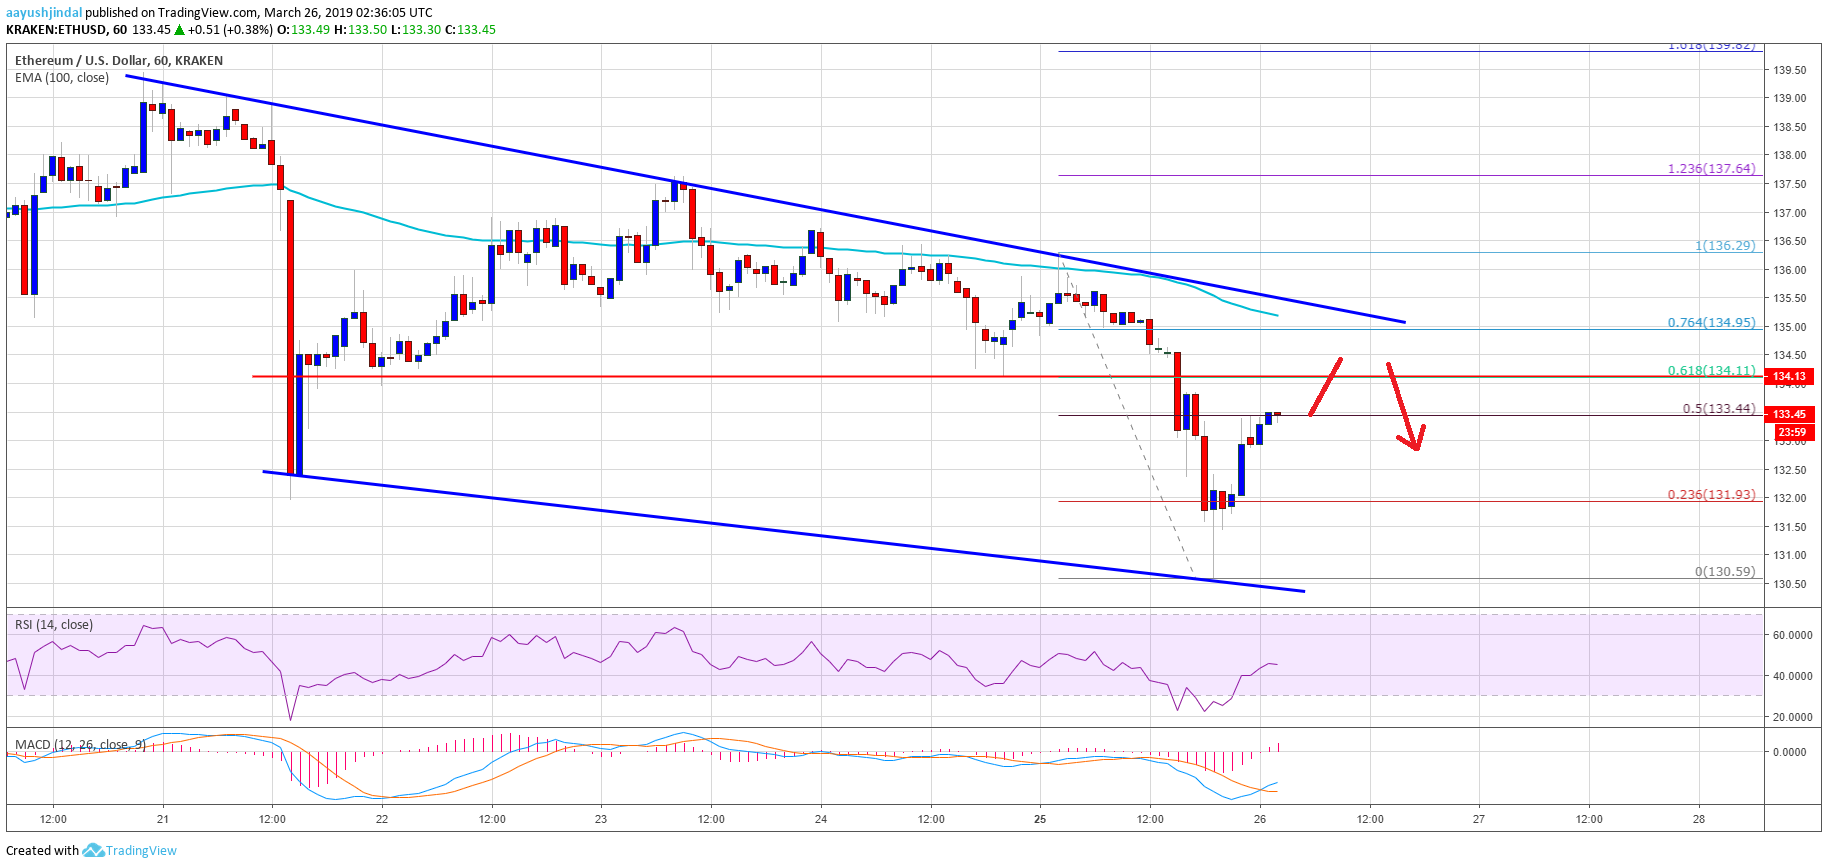
Yesterday, we discussed the importance of the $136-137 resistance and the 100 hourly simple moving average against the US Dollar. The ETH/USD pair made an attempt to climb above the $136 resistance, but it failed to gain momentum. As a result, there was a sharp bearish reaction below the $135 support level. The decline was such that the price even broke the $134 and $132 support levels. It traded to a new weekly low near $130 and later started an upside correction.
Buyers pushed the price above the $132 level and the 23.6% Fib retracement level of the recent decline from the $136 high to $130 low. However, there are many hurdles on the upside near the $134 and $135 levels. The first hurdle is near $134 and the 61.8% Fib retracement level of the recent decline from the $136 high to $130 low. The stated $134 level was a , and now it may act as a resistance. Besides, yesterday’s highlighted key bearish trend line is active with resistance at $135 on the hourly chart of ETH/USD.
Lastly, the 100 hourly SMA is also near the $135 level and the trend line. Therefore, if the price continues to rise it is likely to face sellers near the $134 or $135 resistance. On the downside, an initial support is at $132, below which the price may revisit the $130 swing low. Any further losses could lead the price towards the $125 support.
Looking at the , ETH price is facing a lot of hurdles near $134 and $135. Therefore, buying near the stated resistance and 100 SMA might not be a good idea. Clearly, sellers remain in action near $135 and there are chances of a fresh dip towards $132 or $130 in the coming sessions.
ETH Technical Indicators
Hourly MACD – The MACD for ETH/USD moved into the bullish zone, with a positive bias.
Hourly RSI – The RSI for ETH/USD recovered nicely above 40, but it is still well below the 50 level.
Major Support Level – $130
Major Resistance Level – $135
Published at Tue, 26 Mar 2019 04:08:54 +0000
