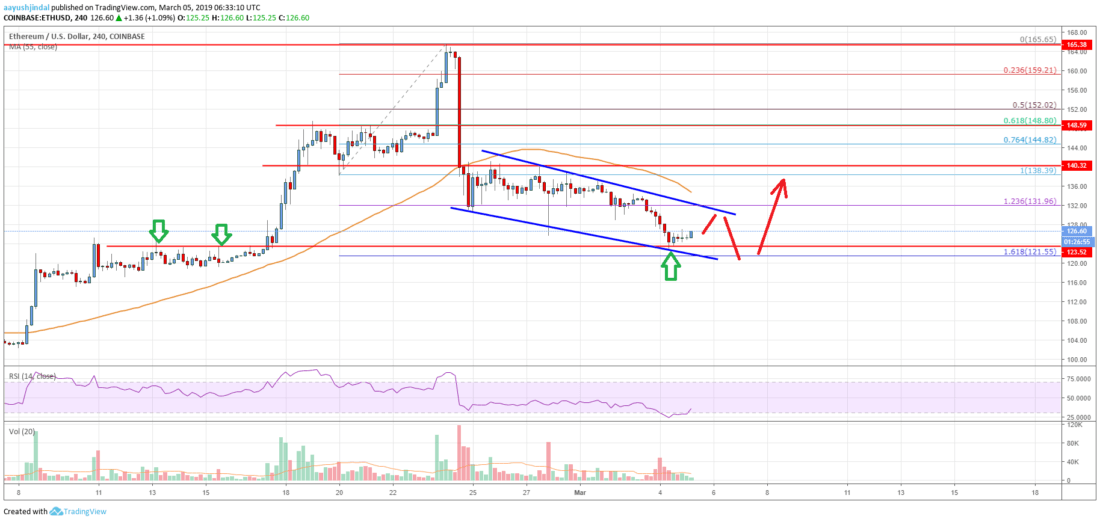
- Ethereum price declined further after it settled below the $140 support level against the US Dollar.
- ETH broke the $132 support and traded close to the key $121-122 support area.
- There is a crucial declining channel in place with resistance at $131 on the 4-hours chart (data feed from Coinbase).
- The price is likely to bounce back as long as it is above the $121 and $122 support levels.
Ethereum price declined heavily below $140 and $130 against the US Dollar. ETH is now trading near a crucial support at $122 and it could bounce back sharply in the near term.
Ethereum Price Analysis
In the past few days, there was a in Ethereum price from the $165 swing high against the US Dollar. The ETH/USD pair broke the $148 and $140 support levels to move into a bearish zone. There was even a close below the$140 level and the 55 simple moving average (4-hours). The decline was such that the price even broke the $132 support area. Moreover, there was a break below the 1.236 Fib extension of the last wave from the $138 low to $165 high.
However, the price is now approaching the key $122 and $121 support levels. The mentioned $121 support acted as a resistance earlier and it is may now act as a solid support. Besides, the 1.618 Fib extension of the last wave from the $138 low to $165 high is near the $121 level. Therefore, there is a significant risk of a in ETH as long as it is above the $121 support. On the upside, an initial resistance is near the $128 level. There is also a crucial declining channel in place with resistance at $131 on the 4-hours chart.
A break above the channel resistance could push the price towards $136 and the 55 simple moving average (4-hours). The main resistance is near the $140 level, where sellers may emerge. On the other hand, if the price breaks the $121 support, there could be a sharp decline.
Looking at the , Ethereum price is clearly trading near a crucial support at $121. If buyers defend the $121-122 support, there is a high chance of a solid rebound above $130 in the coming days. In the mentioned scenario, the price could rise towards the $138 and $140 resistances.
Technical indicators
4 hours MACD – The MACD for ETH/USD is slowly reducing its bearish slope, with hardly any bullish sign.
4 hours RSI (Relative Strength Index) – The RSI for ETH/USD is currently correcting higher and it could test the 40 level.
Key Support Levels – $122, followed by the $120 zone.
Key Resistance Levels – $130 and $136.
Published at Tue, 05 Mar 2019 09:00:16 +0000

![Bitcoin’s [btc] domino effect: ethereum [eth] up by 8%, eos surges 4% in an hour](https://ohiobitcoin.com/storage/2019/05/ETH1H.png "Bitcoin’s [btc] domino effect: ethereum [eth] up by 8%, eos surges 4% in an hour")