- Ethereum price gathered bullish momentum and surged above the $144 resistance against the US Dollar.
- ETH even broke the $150 and $151 resistance levels to move into a strong uptrend.
- There is a significant bullish trend line in place with support at $144 on the 4-hours chart (data feed from Coinbase).
- The price corrected lower after testing the $155 resistance, but dips remain supported.
Ethereum price broke key resistances to gain momentum against the US Dollar. ETH settled above the $144 resistance and it may continue to rise towards $155 and $160.
Ethereum Price Analysis
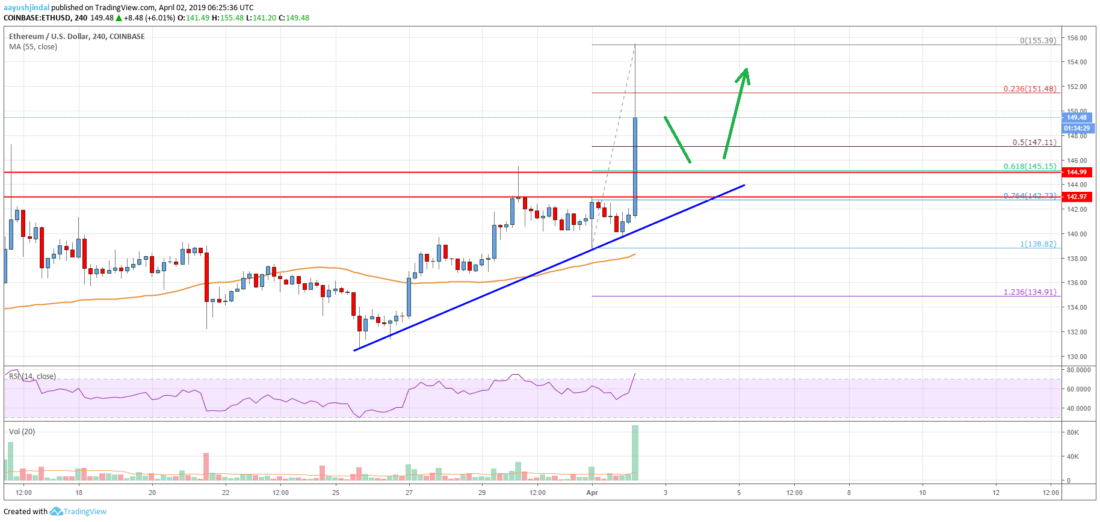
Today, there was a strong rally in above $4,700, sparking upsides in Ethereum price against the US Dollar. Earlier, the ETH/USD pair formed support near $134 and climbed above the $138 level. A decent base was formed above the $138 level and the 55 simple moving average (4-hours). Later, the price gained bullish momentum and traded above the $142 and $144 resistance levels. As a result, there was a sharp upside above the $150 and $152 resistance levels.
The recent rally was such that there was a close above the $144 and $145 resistance levels. The price traded towards the $155 resistance and later retreated from highs. It corrected below the $152 level and the 23.6% Fib retracement level of the recent leg from the $138 swing low to $155 swing high. However, there are many supports near the $150, $147 and $144 levels. The 50% Fib retracement level of the recent leg from the $138 swing low to $155 swing high is also near the $147 level.
The main support is near the $145 and $145 levels since they both were strong hurdles. Moreover, there is a significant bullish trend line in place with support at $144 on the 4-hours chart. The $145 level is also a since it coincides with the 61.8% Fib retracement level of the recent leg from the $138 swing low to $155 swing high. Overall, if there is a downside correction, the $150 and $147 levels are likely to prevent declines, followed by $145.
Looking at the , Ethereum price clearly surged above key resistances near $144-145. It has opened the doors for more upsides above the $152 and $155 resistance levels. The next key stop for buyers could be near the $160 level, above which the price may test the $165 level.
Technical indicators
4 hours MACD – The MACD for ETH/USD is gaining momentum in the bullish zone.
4 hours RSI (Relative Strength Index) – The RSI for ETH/USD is now well above the 60 and 65 levels.
Key Support Levels – $150, followed by the $147 zone.
Key Resistance Levels – $155 and $160.
Published at Tue, 02 Apr 2019 08:08:42 +0000