- ETH price failed to move above the $140 and $142 resistance levels against the US Dollar.
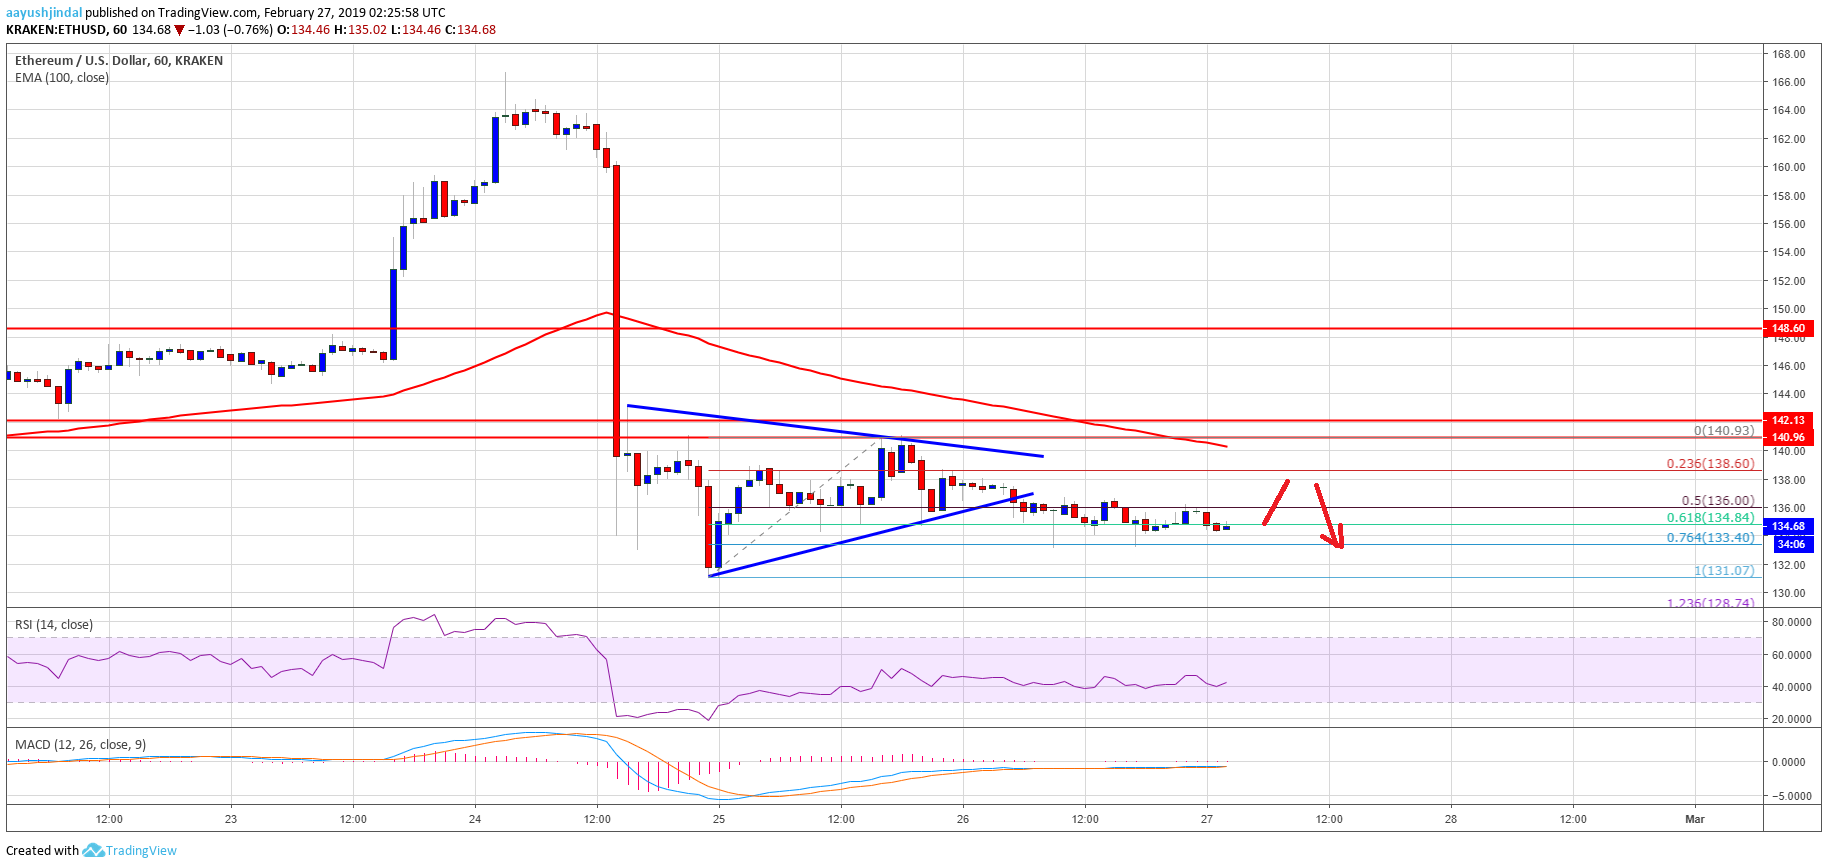
- The price broke the $136 support and it seems like it could continue to move down in the near term.
- Yesterday’s highlighted key breakout pattern was breached with support at $136 on the hourly chart of ETH/USD (data feed via Kraken).
- The pair remains in a bearish zone and it could trade below the $131 and $130 levels.
Ethereum price failed to recover above key levels against the US Dollar and bitcoin. ETH/USD is under pressure and it may continue to move down towards $130 and $126 in the coming sessions.
Ethereum Price Analysis
After , ETH price started an upside correction against the US Dollar. The ETH/USD pair traded above the $135 and $136 resistance levels. However, the upside move was capped by the $140 and $142 resistance levels. Moreover, there was no proper close above the 23.6% Fib retracement level of the last drop from the $166 high to $131 low. The price clearly failed near the $141-142 resistance zone, resulting in a fresh decline.
Finally, the price broke the $137 and $136 support levels to start a fresh bearish moves. It traded below the $136 support and settled below the . Besides, there was a break below the 61.8% Fib retracement level of the recent wave from the $131 low to $141 high. More importantly, yesterday’s highlighted key breakout pattern was breached with support at $136 on the hourly chart of ETH/USD. These all are bearish signs below $136 and suggests more losses in the near term.
An immediate support is at $133 and the 76.4% Fib retracement level of the recent wave from the $131 low to $141 high. If sellers push the price below the $133 level, ETH could revisit the $131 swing low. On the upside, the main resistance levels are near $138, $140 and $142. A successful close above $141-142 followed by a break above the 100 hourly SMA is needed for more gains.
Looking at the , ETH price is placed in a bearish zone and it could trade below the $131 and $130 levels. There are even chances of more losses below the $131 swing low. The next key support is at near the $128 level followed by the $126 level. Below $126, the price could revisit the $120 zone.
ETH Technical Indicators
Hourly MACD – The MACD for ETH/USD is suggesting bearish structure, with a possible flat structure.
Hourly RSI – The RSI for ETH/USD is currently just above the 40 level, with a minor bullish angle.
Major Support Level – $132
Major Resistance Level – $142
Published at Wed, 27 Feb 2019 04:08:57 +0000