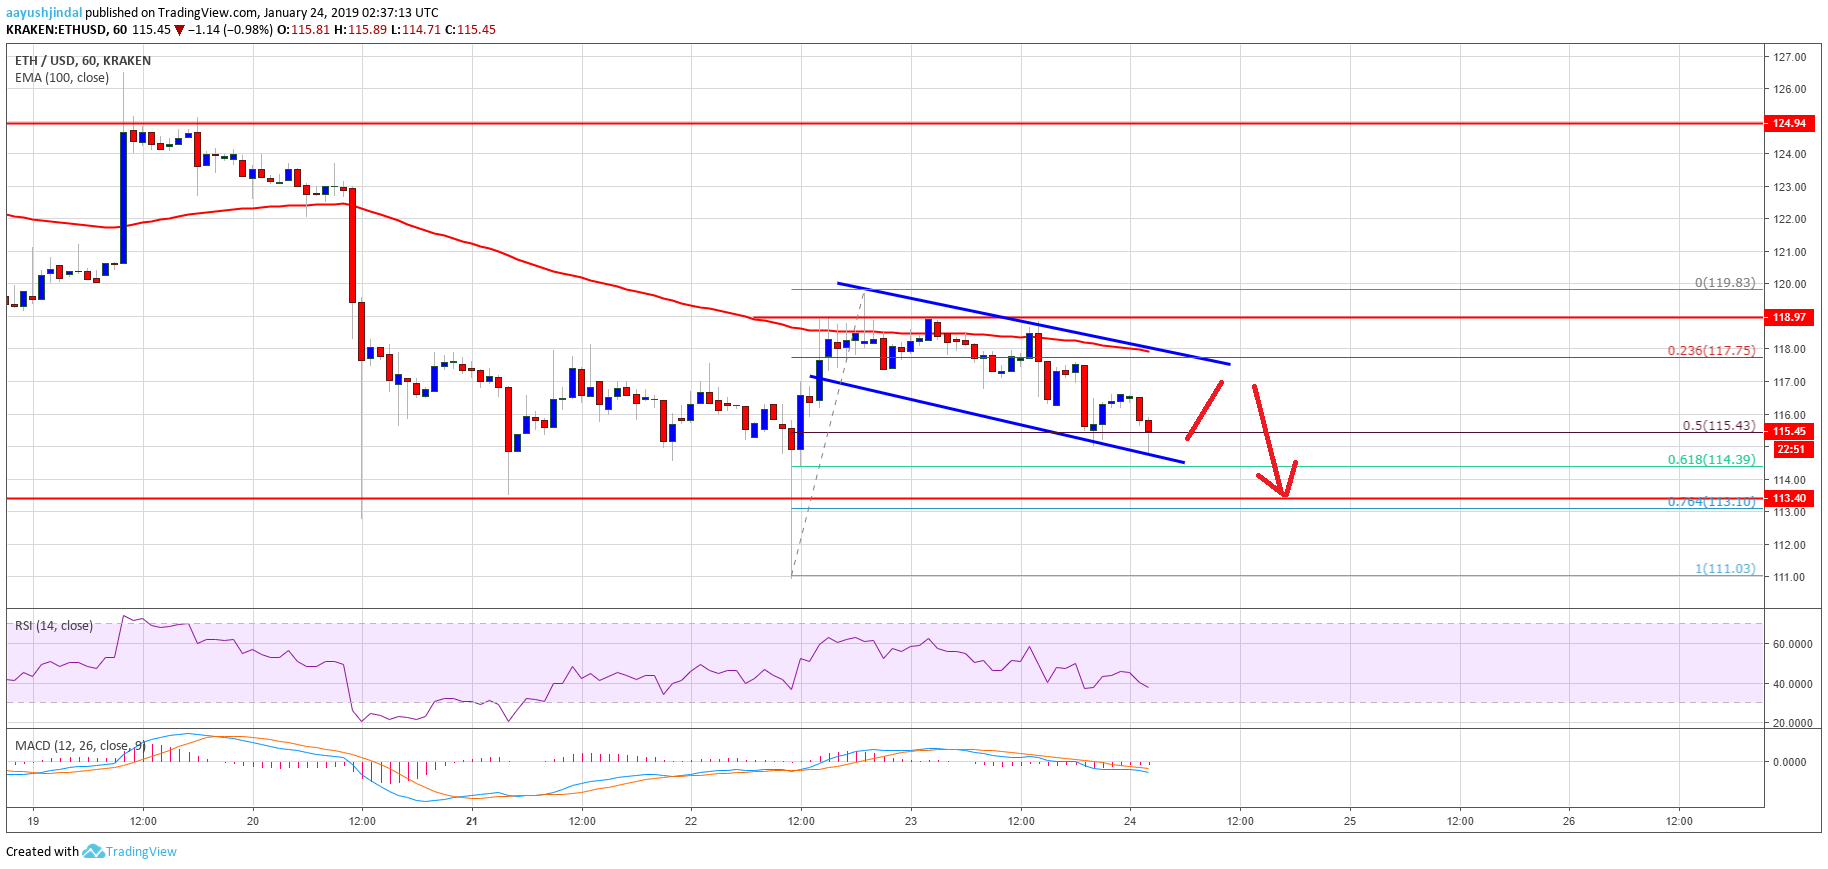
- ETH price tested the $119-120 resistance area and failed to gain strength against the US Dollar.
- There is a short term declining channel formed with resistance near $118 on the hourly chart of ETH/USD (data feed via Kraken).
- The pair is currently at a risk of more losses as long as it is trading below the $118 and $120 hurdles.
Ethereum price failed to stay in the positive zone against the US Dollar and bitcoin BTCUSD. ETH/USD trimmed most its gains and it is likely heading towards the $114 support level.
Ethereum Price Analysis
Yesterday, we saw a above the $114 and $115 resistances in ETH price against the US Dollar. The ETH/USD pair even spiked above the $118 resistance and the 100 hourly simple moving average. However, it failed to break the $120 resistance area. There was also no close above the 61.8% Fib retracement level of the last downside move from the $125 high to $111 swing low. The price started a fresh decline and traded below the $118 level and the 100 hourly SMA.
Moreover, there was a break below the 50% Fib retracement level of the recent wave from the $111 low to $120 swing high. At the outset, there is a short term declining channel formed with resistance near $118 on the hourly chart of ETH/USD. The channel support is at $114, where buyers are likely to emerge. Above $114, the 61.8% Fib retracement level of the recent wave from the $111 low to $120 swing high is a decent support. Below $114, the towards the $112 and $111 levels.
Looking at the , ETH price is facing a major resistance near the channel, $118, and the 100 hourly simple moving average. A successful break and close above $120 is needed for more gains towards $124 and $127. If buyers fail, the price may continue to move down towards $112.
ETH Technical Indicators
Hourly MACD – The MACD for ETH/USD is currently placed in the bearish zone, with negative signs.
Hourly RSI – The RSI for ETH/USD is moving lower towards the 35 and 30 levels.
Major Support Level – $114
Major Resistance Level – $118
Published at Thu, 24 Jan 2019 04:08:00 +0000