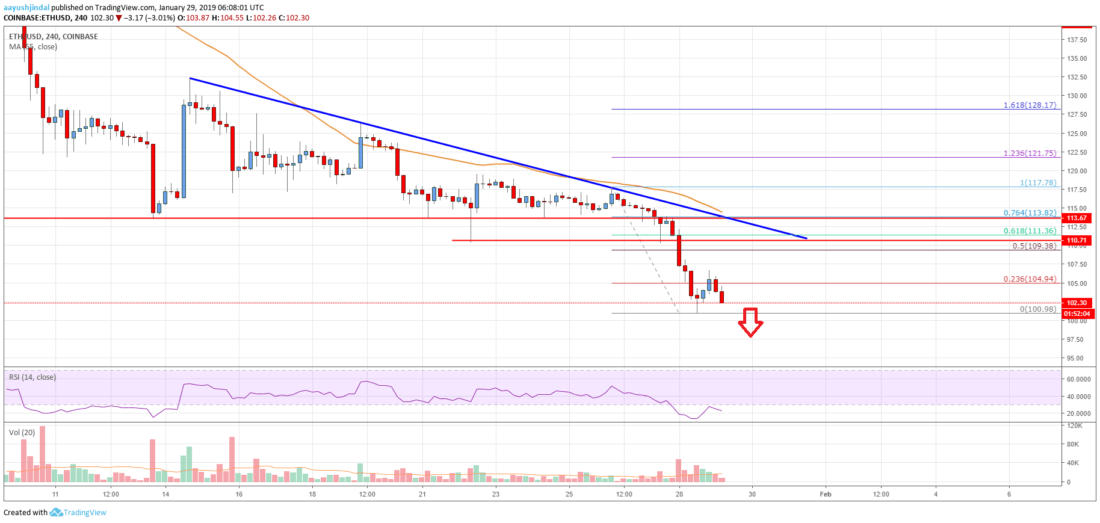
- Ethereum price failed to hold the $114 support and declined heavily below $110 against the US Dollar.
- ETH is trading below a major bearish trend line with resistance at $112 on the 4-hours chart (data feed from Coinbase).
- The price is currently under a lot of pressure and it may slide below $100 and $90 in the near term.
Ethereum price settled below the key $120 and $114 supports against the US Dollar. ETH may now accelerate losses below $100 and it could revisit the 2018 low.
Ethereum Price Analysis
In the past few days, below $130 in Ethereum price against the US Dollar. The ETH/USD pair broke the key $120 and $114 support levels to move into a major downtrend. The price even broke the $111 support and settled below the 55 simple moving average (4-hours). It has opened the doors for more losses below $110. A low was formed at $101 recently before the price corrected a few points. It moved above $105 and the 23.6% Fib retracement level of the last slide from the $118 swing high to $101 swing low.
However, buyers failed to gain pace above the $106 level. The price failed to correct towards the $110 level and the 50% Fib retracement level of the last slide from the $118 swing high to $101 swing low. There is also a major bearish trend line in place with resistance at $112 on the 4-hours chart. Therefore, the price is likely to find a strong selling interest near $109, $110 and $112 levels. To start a decent uptrend, the price must break $114 and the (4-hours). If not, there is a risk of a sharp drop below the $100 support area.
Looking at the , Ethereum price is clearly at a risk of more losses below $101 and $100. The next stop for sellers could be near the 2018 low at $82.
Technical indicators
4-hours MACD – The MACD for ETH/USD is placed strongly in the bearish zone.
4-hours RSI (Relative Strength Index) – The RSI for ETH/USD is currently placed below the 30 level.
Key Support Level – $100
Key Resistance Level – $114
Published at Tue, 29 Jan 2019 10:00:38 +0000