- Ethereum price failed to clear the $140 resistance on many occasions against the US Dollar.
- ETH started a downside move and broke the $136 and $132 support levels.
- There was a break below a connecting bullish trend line with support at $133 on the 4-hours chart (data feed from Coinbase).
- The price is back in a bearish zone and it could extend losses below the $128 and $126 levels.
Ethereum price moved into a bearish zone, with a close below $133 against the US Dollar. ETH may continue to move down and it could even revisit the $122 swing low in the near term.
Ethereum Price Analysis
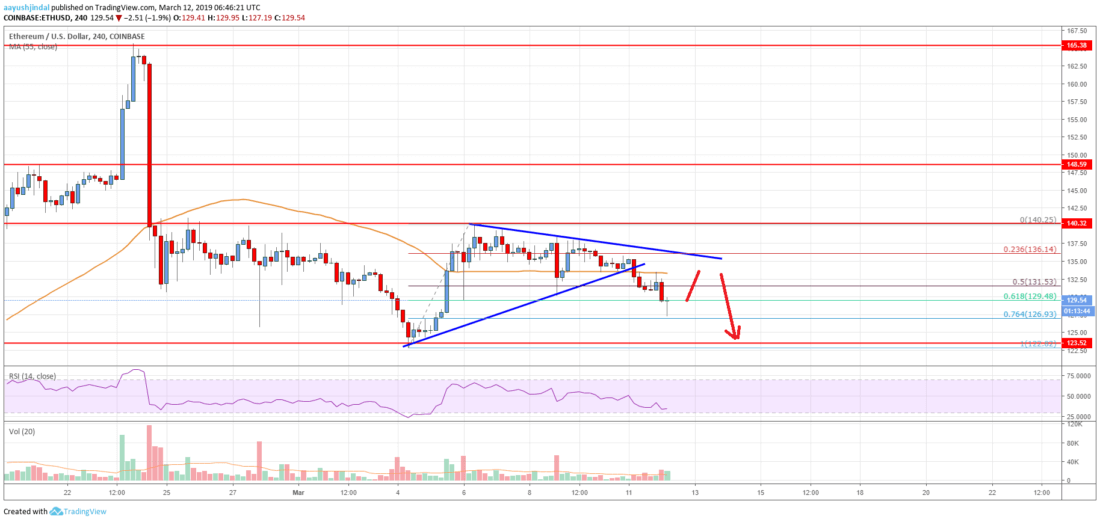
This past week, there was a above $130 in Ethereum price against the US Dollar. The ETH/USD pair even broke the $135 resistance and revisited the $140 barrier. However, buyers failed once again to clear the $140 resistance. As a result, there was a fresh decline and the price traded below the $138 and $136 support levels. There was even a close below the $135 level and the 55 simple moving average (4-hours).
During the slide, the price broke the 50% Fib retracement level of the last wave from the $122 low to $140 high. Moreover, there was a break below a connecting bullish trend line with support at $133 on the 4-hours chart. The pair even broke the $130 level and traded close to the $127 level. The 76.4% Fib retracement level of the last wave from the $122 low to $140 high is also near the $127 level. If there is an upside correction, the $133 level and the 55 simple moving average (4-hours) are likely to act as resistances.
Above the 55 simple moving average (4-hours), there is a key bearish trend line formed with resistance at $136. Therefore, the price is likely to struggle near the $133 and $136 levels in the near term. The remains $140, above which the price could test $148. On the downside, the $127 level is an initial support. If there are more losses, the price is likely to break the $125 level.
Looking at the , Ethereum price is back in a bearish zone and it could revisit the $122 swing low. If there is an upside correction, the price could struggle to clear the $136 resistance level. The overall bias remains bearish as long as the price is below $136 and $140.
Technical indicators
4 hours MACD – The MACD for ETH/USD is gaining momentum in the bearish zone, with a strong downturn.
4 hours RSI (Relative Strength Index) – The RSI for ETH/USD is currently well below the 40 level.
Key Support Levels – $125, followed by the $122 zone.
Key Resistance Levels – $133 and $136.
Published at Tue, 12 Mar 2019 08:08:03 +0000