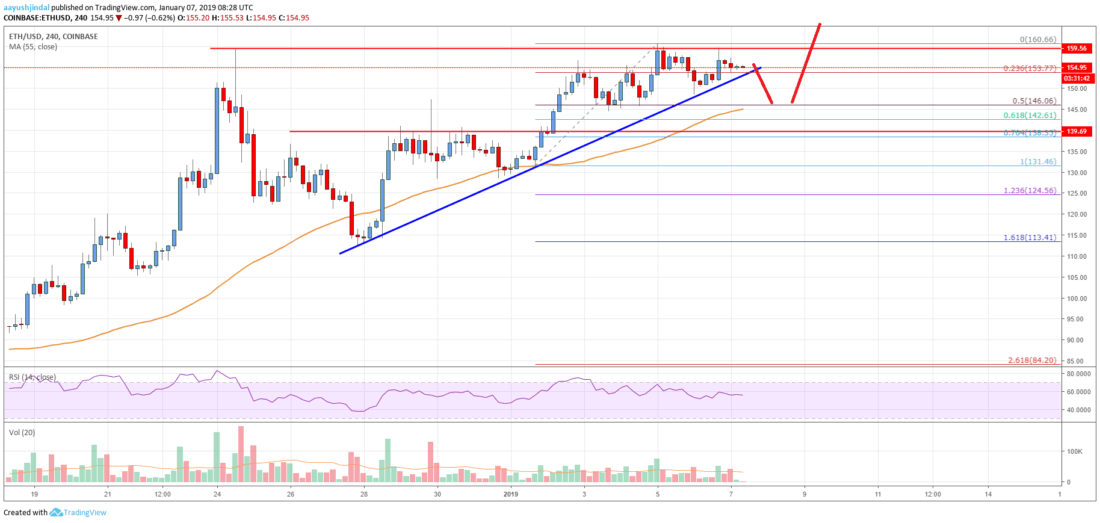
- Ethereum price revisited the $160 resistance where sellers emerged against the US Dollar.
- ETH is approaching a crucial bullish trend line with support at $152 on the 4-hours chart (data feed from Coinbase).
- The price is about to make the next move either above $160 or towards $140.
Ethereum price is struggling to clear the $160 barrier against the US Dollar. ETH may decline towards $140 if it continues to struggle near $159-160.
Ethereum Price Analysis
After forming a the $130 level, Ethereum price started an upward move against the US Dollar. The ETH/USD pair broke the $146 and $150 resistance levels. There was even a close above the $146 level and the 55 simple moving average (4-hours). The price tested the $159-160 resistance area, which acted as a solid barrier for buyers once again and prevented further gains.
A high was formed at $160.66 and later the price corrected lower. It recently dipped below the 23.6% Fib retracement level of the last wave from the $132 low to $160 high. However, there is a strong support formed near the $153-154 area. There is also a crucial bullish trend line with support formed at $152 on the 4-hours chart. If there is a downside break below the trend line, the price may test the $146 support. It represents the 50% Fib retracement level of the last wave from the $132 low to $160 high. Besides, the 55 simple moving average (4-hours) is also near the $146 level. Therefore, if there is a downside break below $153, the price could decline towards the $146 support. Below the $146 support, the towards the key $140 pivot area.
Looking at the , Ethereum price seems to facing a solid barrier near the $159-160 zone. A break above the $160 resistance could push the price towards $168 or $174. On the other hand, a bearish break below $153 may delay a break above the $160 resistance.
Technical indicators
4-hours MACD – The MACD for ETH/USD is slightly tilting into the bearish zone, signaling a possible downside break.
4-hours RSI (Relative Strength Index) – The RSI for ETH/USD is still above the 50 level.
Key Support Level – $146
Key Resistance Level – $160
Published at Mon, 07 Jan 2019 10:00:57 +0000
