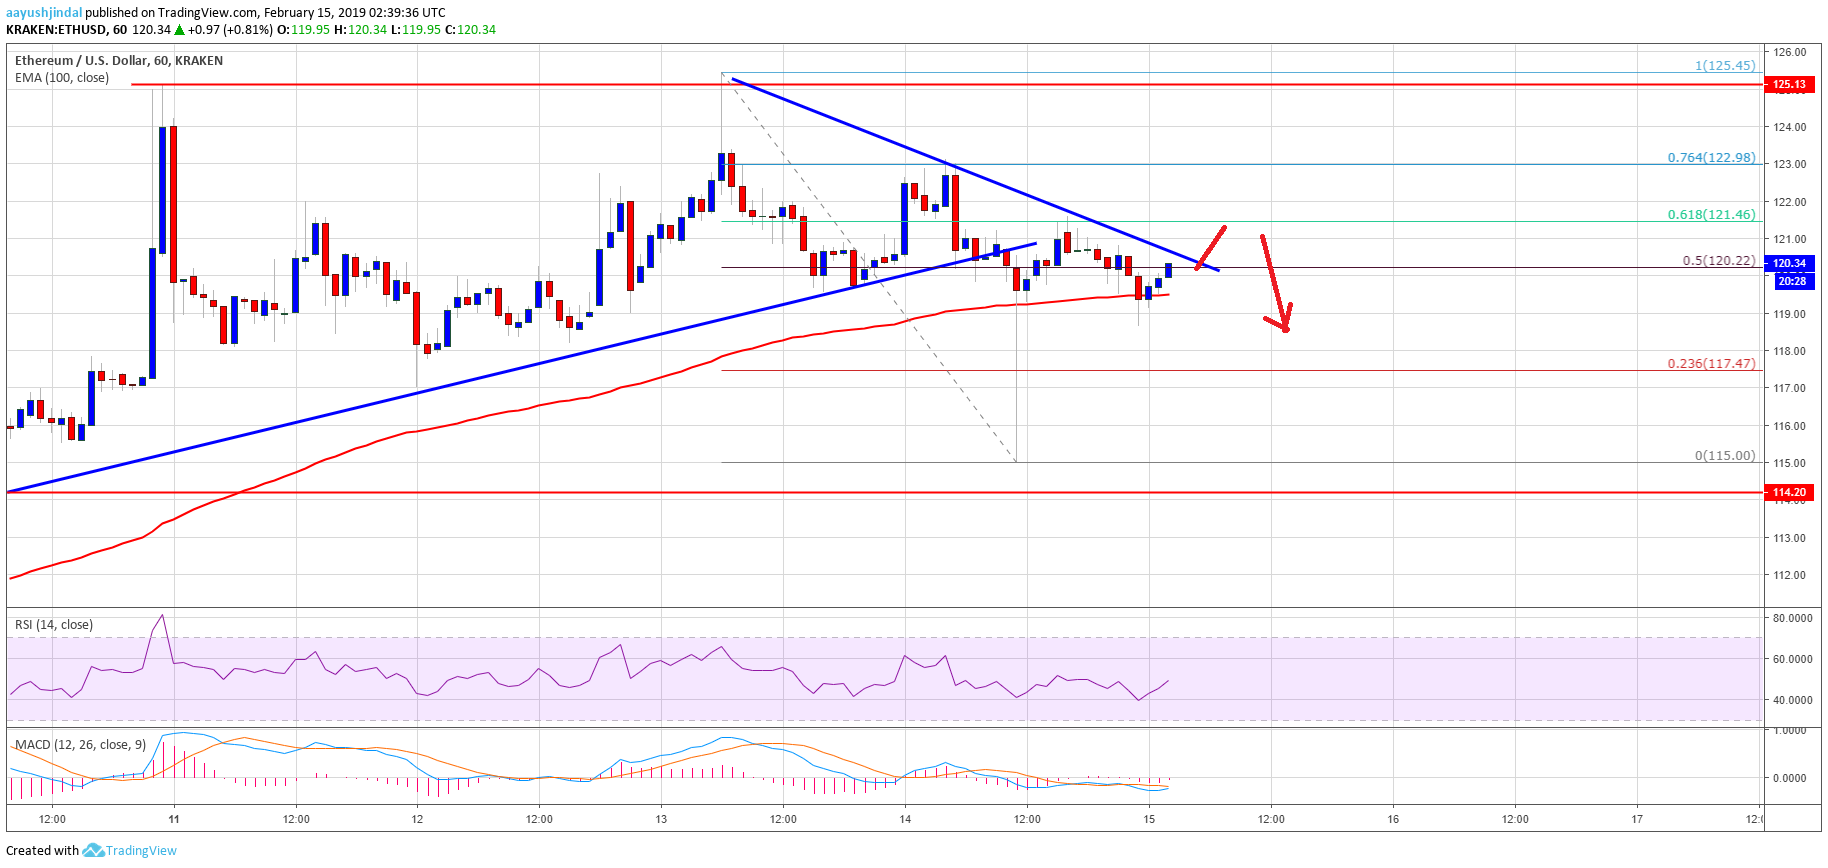
- ETH price struggled to stay above the $121 and $119 support levels against the US Dollar.
- This week’s followed major bullish trend line was breached with support at $121 on the hourly chart of ETH/USD (data feed via Kraken).
- There is a new connecting bearish trend line in place with resistance at $121 on the same chart.
- The price could revisit $121-122 resistance zone, where sellers are likely to reemerge.
Ethereum price is pointing a few bearish signs against the US Dollar and bitcoin. ETH/USD is now at a risk of an extended decline towards the $117 or $114 support level in the near term.
Ethereum Price Analysis
In the past few days, we in ETH price below the $124 and $125 resistances against the US Dollar. The ETH/USD pair failed to break the $125 resistance and it recently declined below the $121 and $119 support levels. The decline was such that there was a spike below the $117 level and the 100 hourly simple moving average. More importantly, this week’s followed major bullish trend line was breached with support at $121 on the hourly chart of ETH/USD. The pair traded close to the $115 support and later bounced back sharply above $117.
Buyers were able to take the price above the 50% Fib retracement level of the recent decline from the $125 high to $115 low. However, the previous support levels near $121 and $122 are acting as hurdles for buyers. Besides, there is a new connecting bearish trend line in place with resistance at $121 on the same chart. The price also struggled to clear the 61.8% Fib retracement level of the recent decline from the $125 high to $115 low. At the moment, it seems like the price might jump above the $121 level, but upsides are likely to remain capped. If buyers struggle to push the price above the $122-123 zone, there could be a .
Looking at the , ETH price is somewhat struggling below the $122-123 resistance zone. Having said that, the price needs to clear the last swing high at $125 to continue higher in the near term. If not, there is a risk of more losses below $119 and $117 in the near term. The main supports for a major decline is around the $114 and 115 levels.
ETH Technical Indicators
Hourly MACD – The MACD for ETH/USD could move back in the bullish zone, but there are many negative signs visible.
Hourly RSI – The RSI for ETH/USD jumped higher after testing the 40 level and it is currently just above 50.
Major Support Level – $117
Major Resistance Level – $125
Published at Fri, 15 Feb 2019 04:08:40 +0000