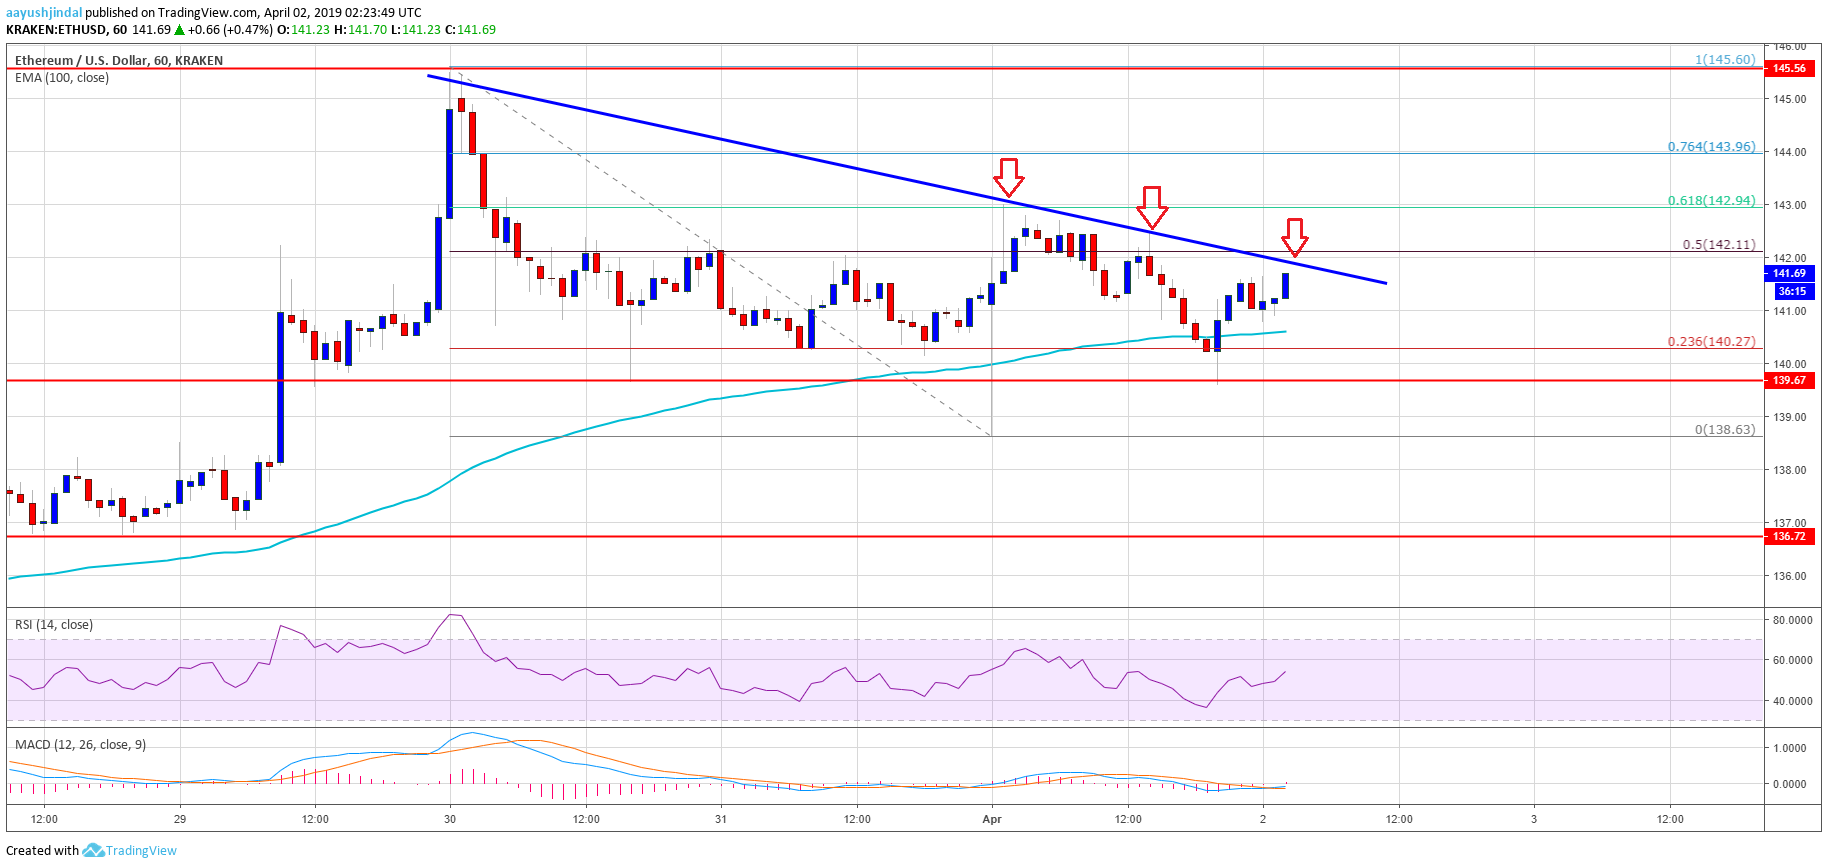
- ETH price dipped once again and tested the key $139 support area against the US Dollar.
- The price is moving higher, but it must break the $142 and $143 resistance levels for more gains.
- There is a major bearish trend line in place with resistance at $142 on the hourly chart of ETH/USD (data feed via Kraken).
- The pair might trade in a range for some time, but sooner or later it is likely to revisit $145.
Ethereum price is currently consolidating in a range against the US Dollar and . ETH remains well bid on the downside and it could resume its upside above $142 and $144.
Ethereum Price Analysis
Recently, we saw a sharp dip below the $140 level in ETH price against the US Dollar. However, the ETH/USD pair found a strong support near the $139 level and later it bounced back. It settled above the $140 level and the . Buyers pushed the price above the $142 level and the 50% Fib retracement level of the last slide from the $146 swing high to $139 swing low. However, the last wave was capped by the $143 resistance level.
Besides, the 61.8% Fib retracement level of the last slide from the $146 swing high to $139 swing low acted as a strong resistance. There is also a major bearish trend line in place with resistance at $142 on the hourly chart of ETH/USD. The pair dipped again recently and retested the $139 support. However, sellers failed to gain momentum below $139. The price is currently moving higher towards the $142 resistance and the same trend line. A successful close above the trend line, followed by an increase in momentum above $143 is needed for more upsides.
The next key resistance is near the $145 level and the last swing high. If buyers gain momentum, there could be a break above the $146 level and the price could rally towards $150. On the downside, an initial support is near the $140 level and the 100 hourly simple moving average. The main support is $139, below which the price may turn bearish in the short term.
Looking at the , Ethereum price seems to be struggling to gain pace above $142 and $143. Once buyers succeed in clearing the mentioned hurdles, there could be a fresh increase above $145 and $146 in the coming sessions.
ETH Technical Indicators
Hourly MACD – The MACD for ETH/USD is about to move back in the bullish zone, with a positive bias.
Hourly RSI – The RSI for ETH/USD is currently moving higher, with a positive angle above the 50 level.
Major Support Level – $140
Major Resistance Level – $143
Published at Tue, 02 Apr 2019 04:08:25 +0000

