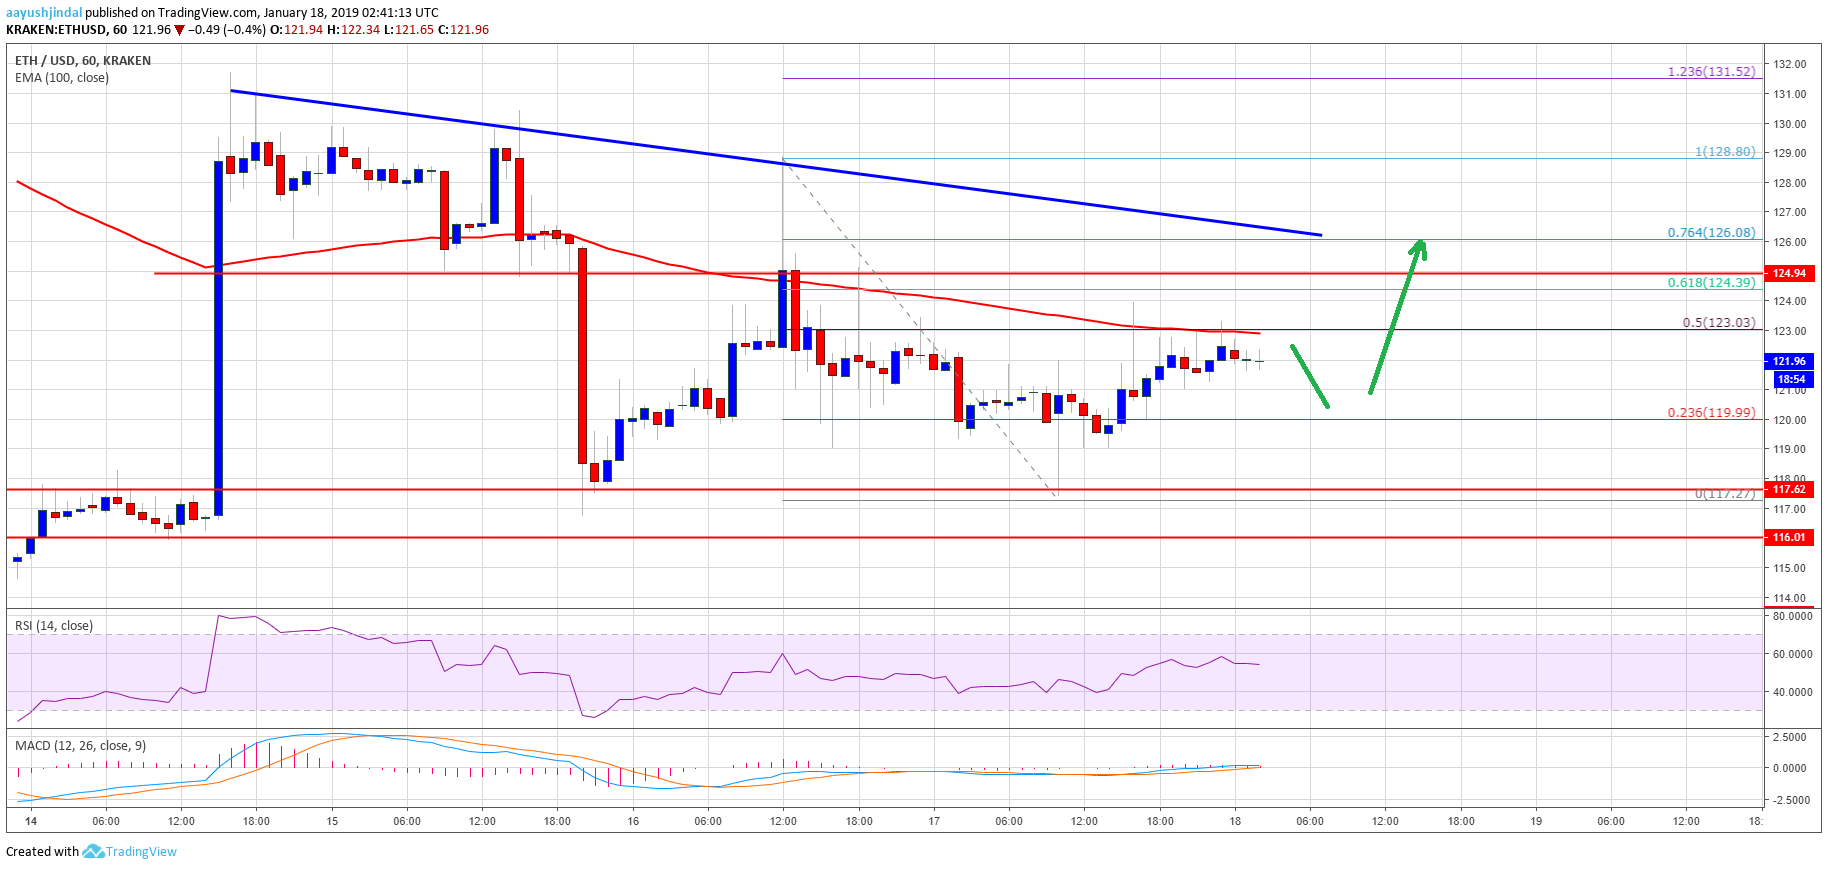
- ETH price is currently consolidating above the $116 and $117 support levels against the US Dollar.
- Yesterday’s highlighted key bearish trend line is active with resistance at $126 on the hourly chart of ETH/USD (data feed via Kraken).
- The pair may gain bullish momentum sooner or later as long as it is above the $116 support.
Ethereum price is trading in ranges against the US Dollar and bitcoin [BTC]. ETH/USD might start a solid upward move if it continues to hold the $116 support area in the near term.
Ethereum Price Analysis
Recently, above the $125 resistance made an attempt to break $128 against the US Dollar. However, the ETH/USD pair failed to gain strength above the $128 resistance and later declined. It moved below the $125 and $123 support levels. More importantly, there was a break below the $121 level and the 100 hourly simple moving average. However, the $116 and $117 support levels once again acted as a solid support and prevented more declines.
A low was formed near $117.27 and the price later recovered. It climbed above the 23.6% Fib retracement level of the last drop from the $128 high to $117 low. On the upside, there are many hurdles for buyers, starting with the $123 level and the . It also coincides with the 50% Fib retracement level of the last drop from the $128 high to $117 low. Besides, yesterday’s highlighted key bearish trend line is active with resistance at $126 on the hourly chart of ETH/USD. An intermediate resistance is near the $125 level and the 61.8% Fib retracement level of the last drop.
Looking at the , ETH price is likely to struggle to clear the $123, $125 and $128 resistance levels. Having said that, as long as the price is above $116, it could start a steady rise in the near term.
ETH Technical Indicators
Hourly MACD – The MACD for ETH/USD is slightly placed in the bullish zone, with a flat structure.
Hourly RSI – The RSI for ETH/USD is moving nicely above the 50 level, but with no bullish signals.
Major Support Level – $116
Major Resistance Level – $128
Published at Fri, 18 Jan 2019 04:08:11 +0000